DEEP CTN Scale

Descriptive Data
Data collected on 29 Jan 2024
Demographics
Mean age: 43.76 years old (SD = 14.53); range: 18, 83
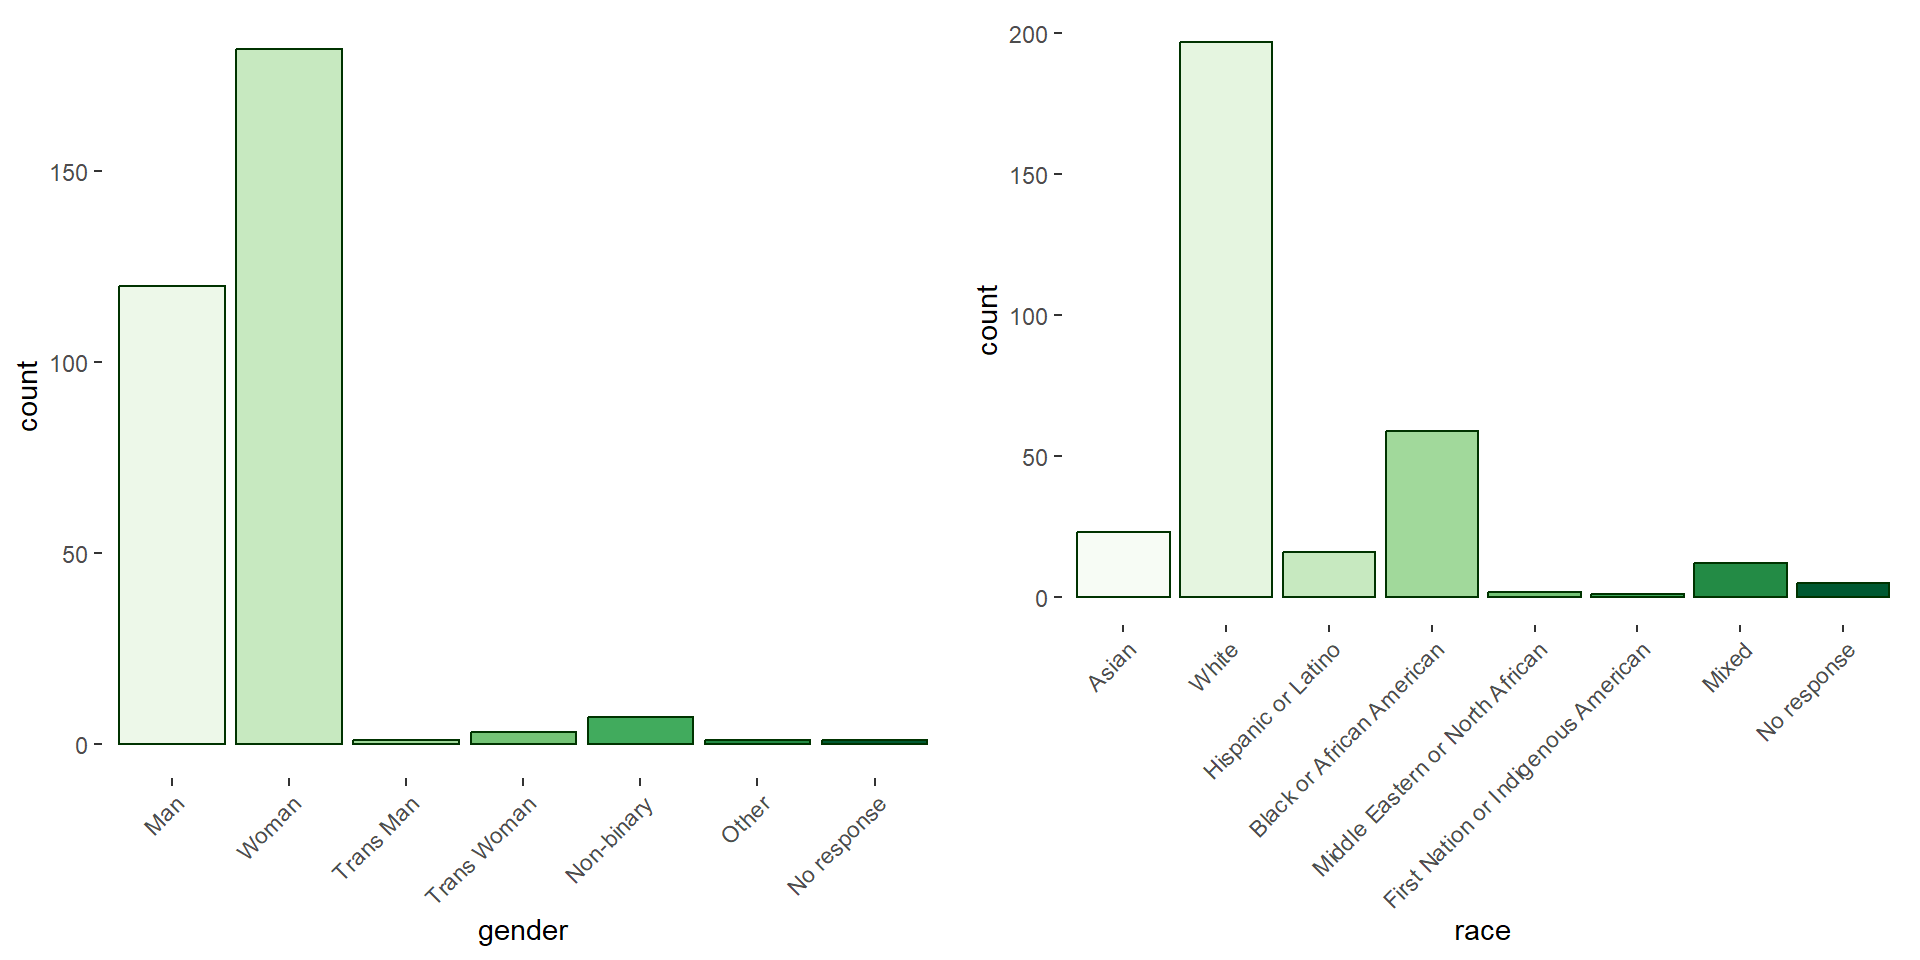
Confirmatory Factor Analysis - FULL SCALE
Before conducting the CFA we tested the assumptions of CFA models to show multivariate normality via acceptable Mardia’s skewness and kurtosis values. We used the general guidelines that the closer to zero both skewness and kurtosis values, the closer to a normal distribution. Any item whose skewness value was greater than |1| and/or kurtosis value was greater than |3|, were considered non-normal (either strongly skewed or having peaked or flat kurtosis) would be removed from the analysis (Hair et al., 2017, p. 61).
Three items showed high negative skew high kurtosis and were removed from further analysis (see Table 1 for details)[^1]. These items were also found to be extremes in the pilot studies.
Table 1. Items removed due to extreme skew & kurtosis
Code | Items | skew | kurtosis | Data |
|---|---|---|---|---|
CTN_exp_7 | Listening to the sounds of nature makes me relax | -1.42 | 4.96 | |
CTN_emo_5 | I am careful to not step on snails | -1.15 | 3.29 | |
CTN_spirit_5 | I have great respect for being alive on this earth and part of the universe | -1.13 | 3.99 |
Zero order correlations for all items were calculated to ensure that items within a factor are not too weakly (r < 0.30) correlated, and that items between factors are not too strongly (r > 0.75) correlated.
One item had consistently low correlation with other items in its expected factor (CTN_EMO_2: “If one of my plants died, I would blame myself”). This item was retained as the emotional factor was already reduced to 4 items. No items had high correlations with other items in other factors.
To ensure the correct rotation method was used, tests of multivariate and univariate normality were conducted. Using the MVN package in R, a Mardia test of multivariate and univariate normality found that this data is not normal distributed (MVN?). As such, we chose to use a rotation-method that is robust to non-normal data. However, normality is not considered a critical assumption for factor analysis (garson2022a?, p 22).
Descriptive Stats for CFA Full
##       deep  emo  exp mind total
## deep  1.00 0.55 0.66 0.68  0.86
## emo   0.55 1.00 0.55 0.52  0.79
## exp   0.66 0.55 1.00 0.60  0.84
## mind  0.68 0.52 0.60 1.00  0.84
## total 0.86 0.79 0.84 0.84  1.00
##
## n= 315
##
##
## P
##       deep emo exp mind total
## deep        0   0   0    0
## emo    0        0   0    0
## exp    0    0       0    0
## mind   0    0   0        0
## total  0    0   0   0
Dimension | Alpha | Mean | SD | 1 | 2 | 3 | 4 |
|---|---|---|---|---|---|---|---|
1. Deep | 0.88 | 4.61 | 1.33 | 1 | |||
2. Emotional | 0.70 | 4.69 | 1.40 | 0.55*** | 1 | ||
3. Experiential | 0.89 | 4.73 | 1.40 | 0.66*** | 0.55*** | 1 | |
4. Presence | 0.87 | 4.54 | 1.37 | 0.68*** | 0.52*** | 0.6*** | 1 |
Total | 0.94 | 4.64 | 1.15 | 0.86*** | 0.79*** | 0.84*** | 0.84*** |
Table 2. Items tested for the Full DEEP Connection to Nature Scale
Subscale | Code | Items |
|---|---|---|
Deep | CTN_spirit_1 | I view nature as a mother who nurtures and cares for me |
Deep | CTN_spirit_2 | Human beings and nature are connected by the same energy or Life-force |
Deep | CTN_spirit_3 | My connection to nature is something I would describe as *spiritual* |
Deep | CTN_spirit_4 | Every part of nature is sacred |
Deep | CTN_spirit_6 | I like the idea that, when I die, my body will return to the earth, nourishing the soil |
Deep | CTN_spirit_7 | I think about the *shared breath* between myself and plants; I breathe in the oxygen released by plants, and plants use the carbon dioxide I exhale |
Deep | CTN_spirit_8 | I often think about the fact that all life is grounded on this planet that is revolving around the sun |
Deep | CTN_spirit_9 | Indoor plants are part of the family |
Deep | CTN_spirit_10 | When I eat, I feel thankful for the animals, plants, and earth for nourishing me |
Experiential | CTN_exp_1 | I like to get outdoors whenever I get the chance |
Experiential | CTN_exp_2 | I feel uneasy if I am away from nature for too long |
Experiential | CTN_exp_3 | I engage and participate with nature to find meaning and richness in life |
Experiential | CTN_exp_4 | My favorite place is in nature |
Experiential | CTN_exp_5 | Walking through a forest makes me forget about my daily worries |
Experiential | CTN_exp_6 | I prefer outdoor to indoor sports |
Experiential | CTN_exp_8 | I hike or run in nearby nature |
Emotional | CTN_emo_1 | Seeing a cleared forest is upsetting to me |
Emotional | CTN_emo_2 | If one of my plants died, I would blame myself |
Emotional | CTN_emo_3 | Thinking of someone carving their initials into a tree makes me cringe |
Emotional | CTN_emo_4 | If there is an insect, such as a fly or a spider, in my home, I try to catch and release it rather than kill it |
Emotional | CTN_emo_6 | I talk to the wild animals I encounter (e.g., birds, lizards, rabbits, squirrels) |
Presence | CTN_mind_1 | I take time to watch the clouds pass by |
Presence | CTN_mind_2 | I deliberately take time to watch stars at night |
Presence | CTN_mind_3 | When possible, I take time to watch the sunrise or the sunset without distractions |
Presence | CTN_mind_4 | I consciously watch or listen to birds |
Presence | CTN_mind_5 | I take time to consciously smell flowers |
Presence | CTN_mind_6 | I pay attention to the current phase of the moon |
Hypothesis 1 - Dimensional Structure
Based on previous multi-dimensional CTN measures and pilot data using both exploratory factor analysis and confirmatory factor analysis, our first hypothesis is that a confirmatory factor analysis (CFA) on the DEEP CTN Scale items will confirm a multidimensional structure with four distinct factors and that this multi-dimensional structure will be more informative than a single uni-dimensional structure.
Hypothesis 1.A - Four-factor Structure
A CFA will confirm a multidimensional structure with four unique factors defined as:
- Deep Identity (deeply seeing the self as part of nature)
- Experiential Connection (spending and enjoying time in nature)
- Emotional Connection (Emotional desire to connect with nature and protect it)
- Presence within Nature (engaging mindfully and consciously with nature)
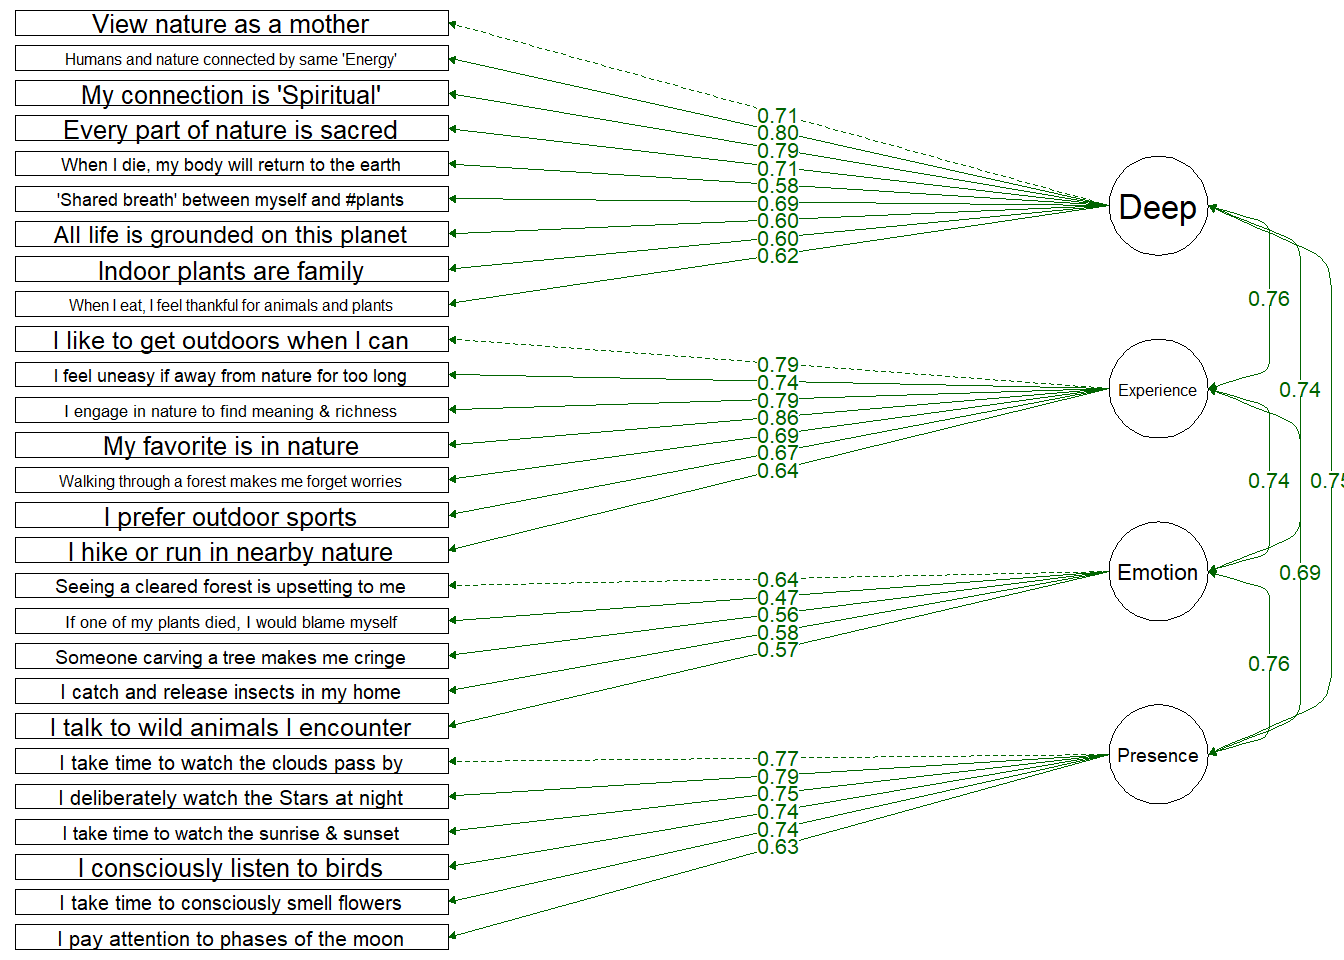
Using the Lavaan package in R (lavaan?), we used the Huber-White maximum likelihood estimation method which is robust to non-normal data. The number of factors was set to four and covariances allowed between them.
Figure 2 shows the standardized estimates for each item regressed onto the four factors. All items significantly loaded onto their respective factors (p < 0.001). In terms of fit indices, the chi-square, root mean square error of approximation, standardized root mean square residual, and the Tucker-Lewis fit index for the four-factor model were acceptable (see Table 3 for model fit comparisons).
Figure 2. Four-factor dimensional structure with standardized estimates
Hypothesis 1.B - Hierarchical factor Structure
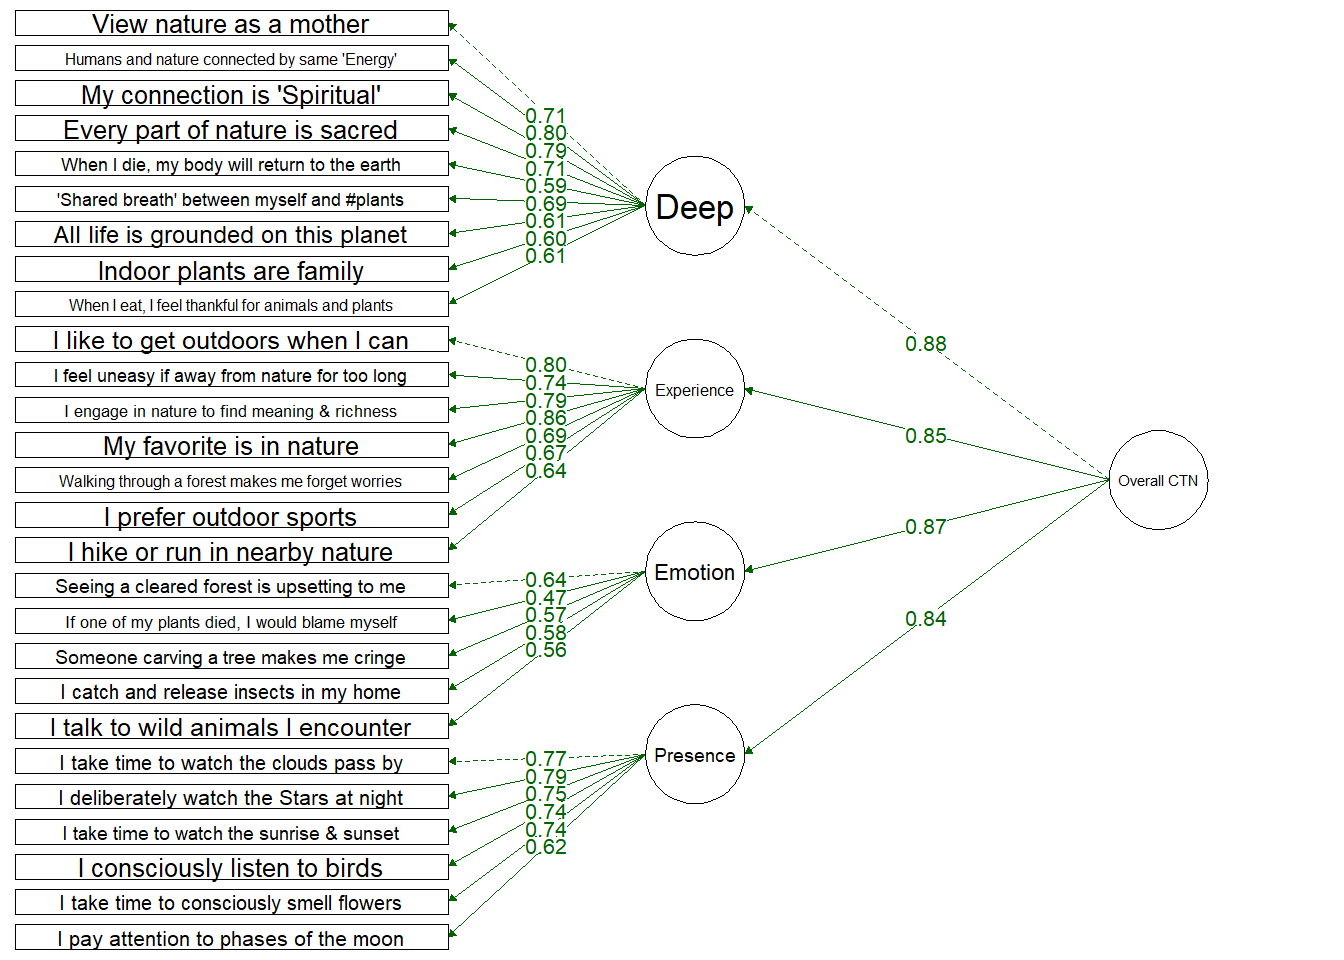
We also hypothesized that all factors would load onto a second-order CTN factor. This would suggest that the factors themselves are associated via one overall CTN construct.
Figure 3 shows the standardized estimates for each item regressed onto the four factors and a second-order CTN factor. All items significantly loaded onto their respective factors (p < 0.001). In terms of fit indices, the chi-square, root mean square error of approximation, standardized root mean square residual, and the Tucker-Lewis fit index for the four-factor model were acceptable (Table 3 for model fit comparisons).
Figure 3. Four-factor hierarchical dimensional structure with standardized estimates
Hypothesis 1.C - Single Factor Model
We further predicted that both of the above models (1. four factor model and 2. four factor hierarchical model) will provide better explanatory fit than a unidimensional factor containing only a total CTN score.
Figure 4 shows the standardized estimates for each item regressed onto a single overarching CTN factor. While al items significantly loaded onto their respective factors (p < 0.001), the fit indices suggest that this model has poor fit (see Table 3 for model fit comparisons).
Figure 4. Unidimensional factor structure with standardized estimates
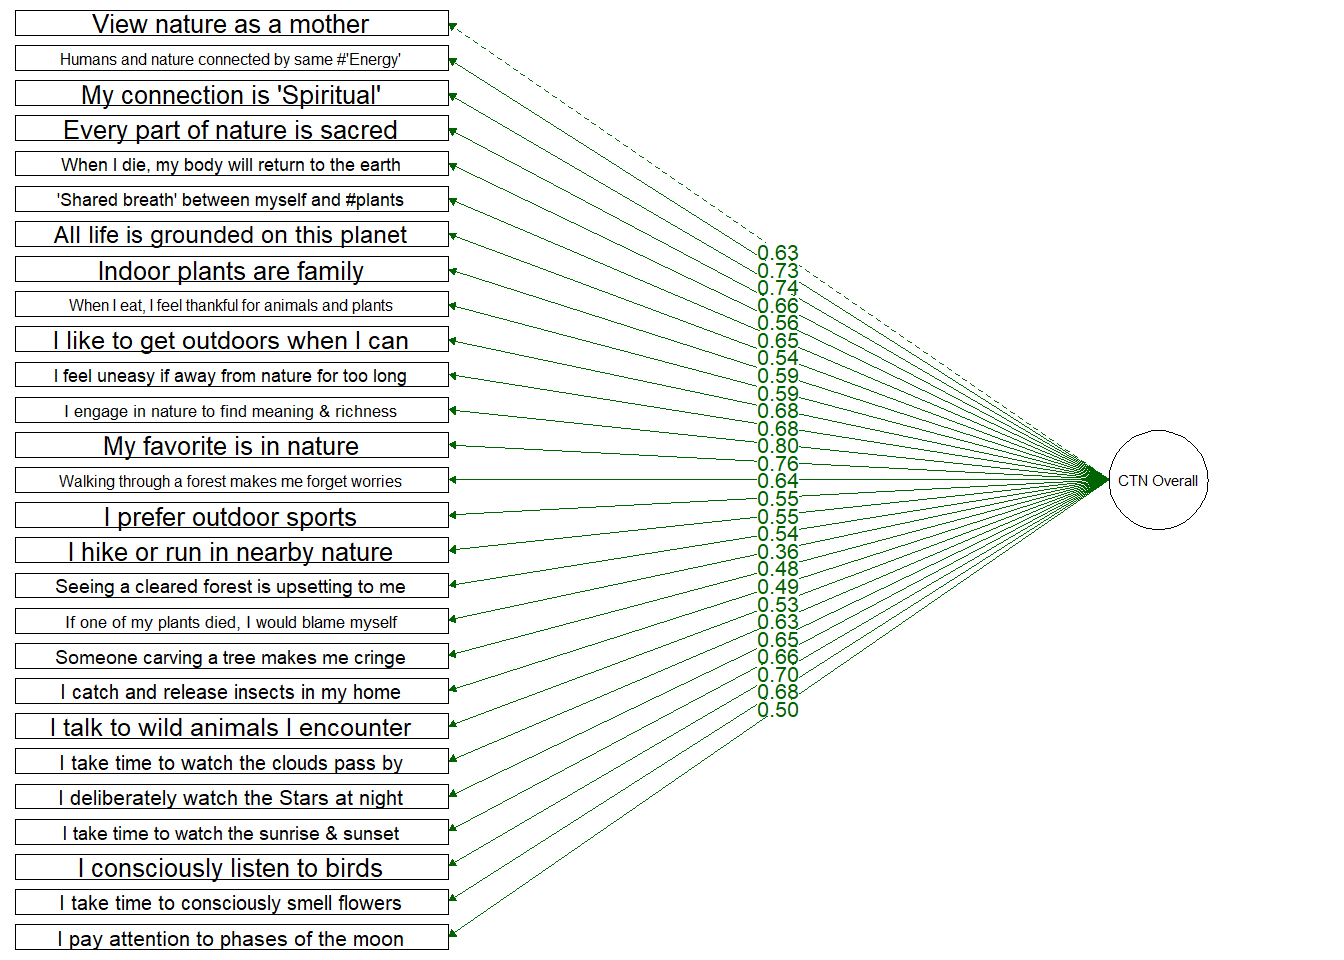
Table 3. Comparative Fit indices for each model
Model | χ² (df)a | RMSEA (95% CI)b | RMSRc | TLId | CFIe | AICf |
|---|---|---|---|---|---|---|
1-Factor | 1410.75 ( 324 ) | 0.1 ( 0.1 - 0.11 ) | 0.07 | 0.73 | 0.75 | 31,110.37 |
4-Factor | 866.52 ( 318 ) | 0.07 ( 0.07 - 0.08 ) | 0.06 | 0.86 | 0.88 | 30,578.14 |
4-Factor Hierarchial | 870.18 ( 320 ) | 0.07 ( 0.07 - 0.08 ) | 0.06 | 0.86 | 0.88 | 30,577.80 |
aChi-Square: Closer to 0 indicate better fit | ||||||
bRoot mean square error: 0.01 = Excellent; 0.05 = Good; 0.08 = Mediocre | ||||||
cStandardized root mean square residual: Closer to 0 indicate better fit | ||||||
dTucker Lewis Index: Closer to 1 indicates better fit | ||||||
eComparative fit index: Closer to 1 indicates better fit | ||||||
fAkaike’s Information Criterion: The lower the AIC, the more predictive | ||||||
An Analysis of Variance comparing the model fit of the four factor structures showed that there was 1. no significant difference between the two multi-dimensional models (Chi-sq= 870.176(320), p = .204).
- the multi-dimensional models had significantly improved fit compared to the unidimensional model (Chi-sq = 1410.746(324), p = < .001).
Shortened DEEP CTN Scale
In order to produce a scale that is not only psychometrically sound, but also practical for use in future research, we conducted a reduced CFA. We retained the five strongest loading items from each factor to create the reduced scale. However, only three items remained in the emotional dimension due to high skew. This resulted in a measure with 18 items.
Figure 5 shows the standardized estimates for each item regressed onto the four factors and a second-order CTN factor. All items significantly loaded onto their respective factors (p < 0.001). In terms of fit indices, the chi-square, root mean square error of approximation, standardized root mean square residual, and the Tucker-Lewis fit index for the four-factor model were acceptable (see Table 3 for model fit comparisons).
Figure 5. Reduced DEEP CTN Scale factor structure with standardized estimates
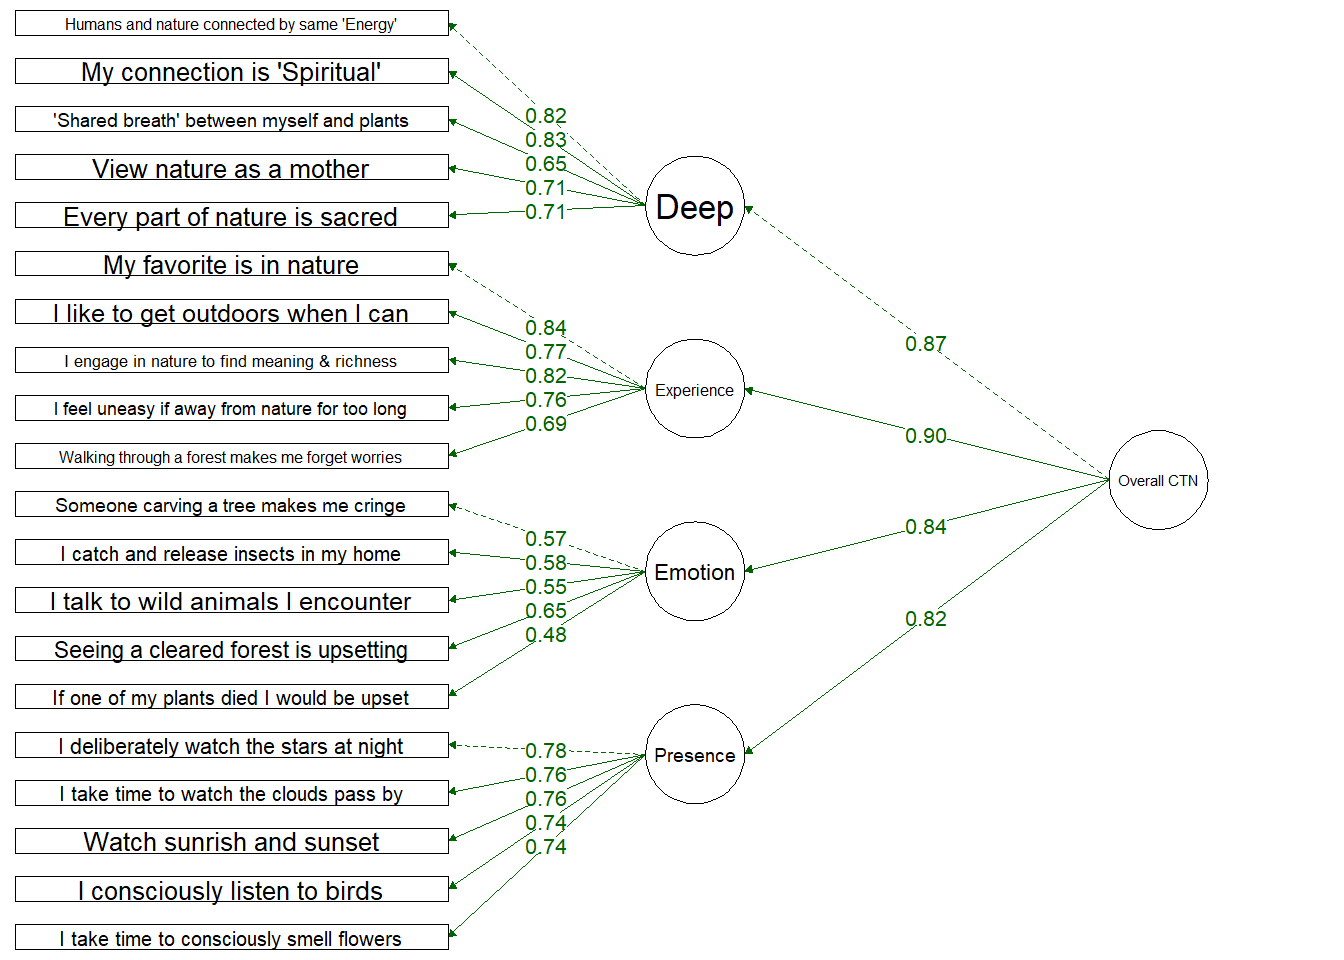
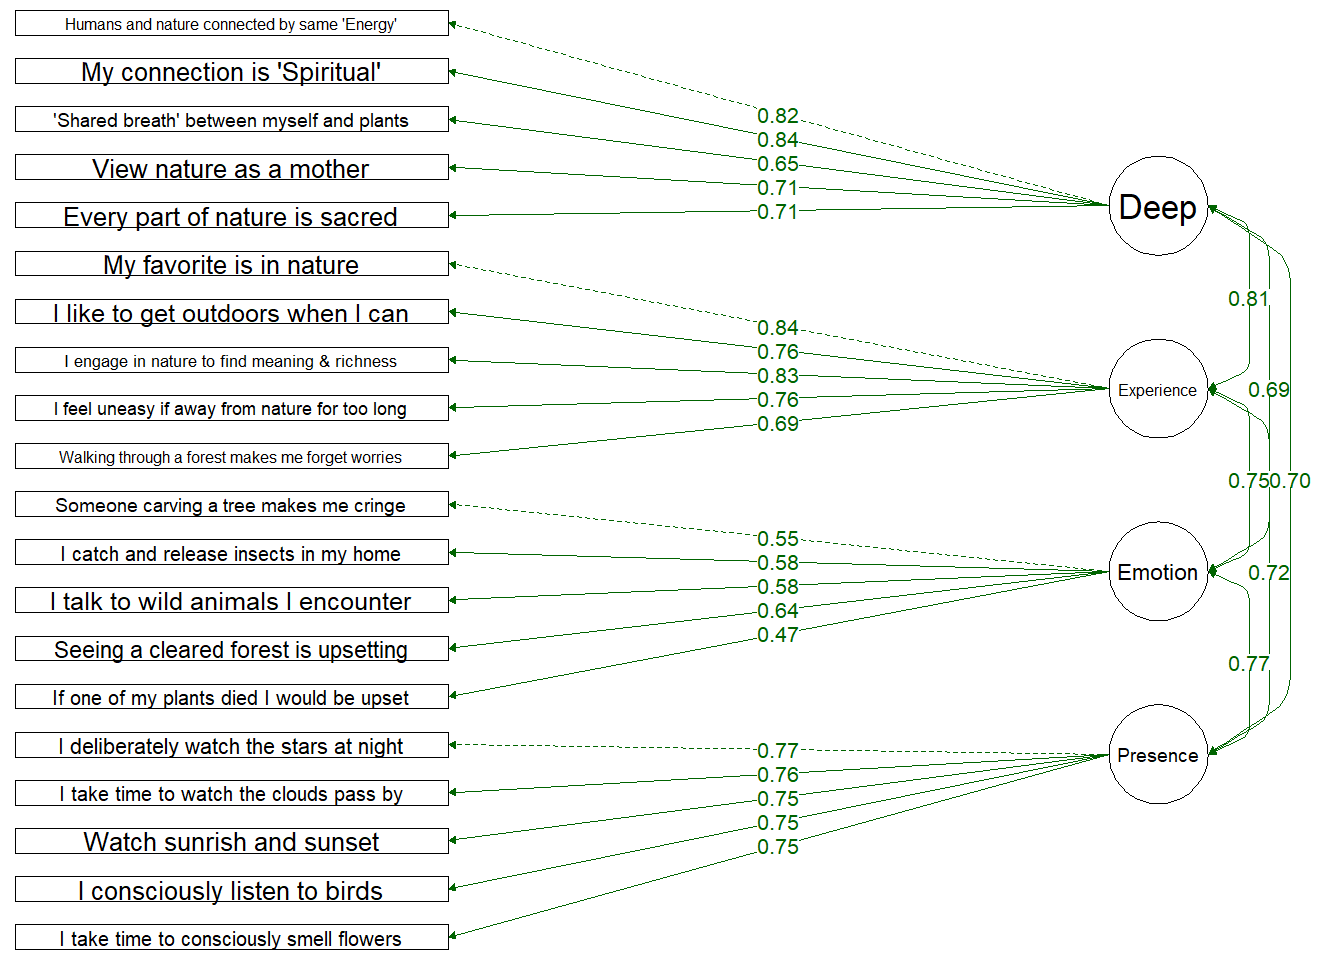
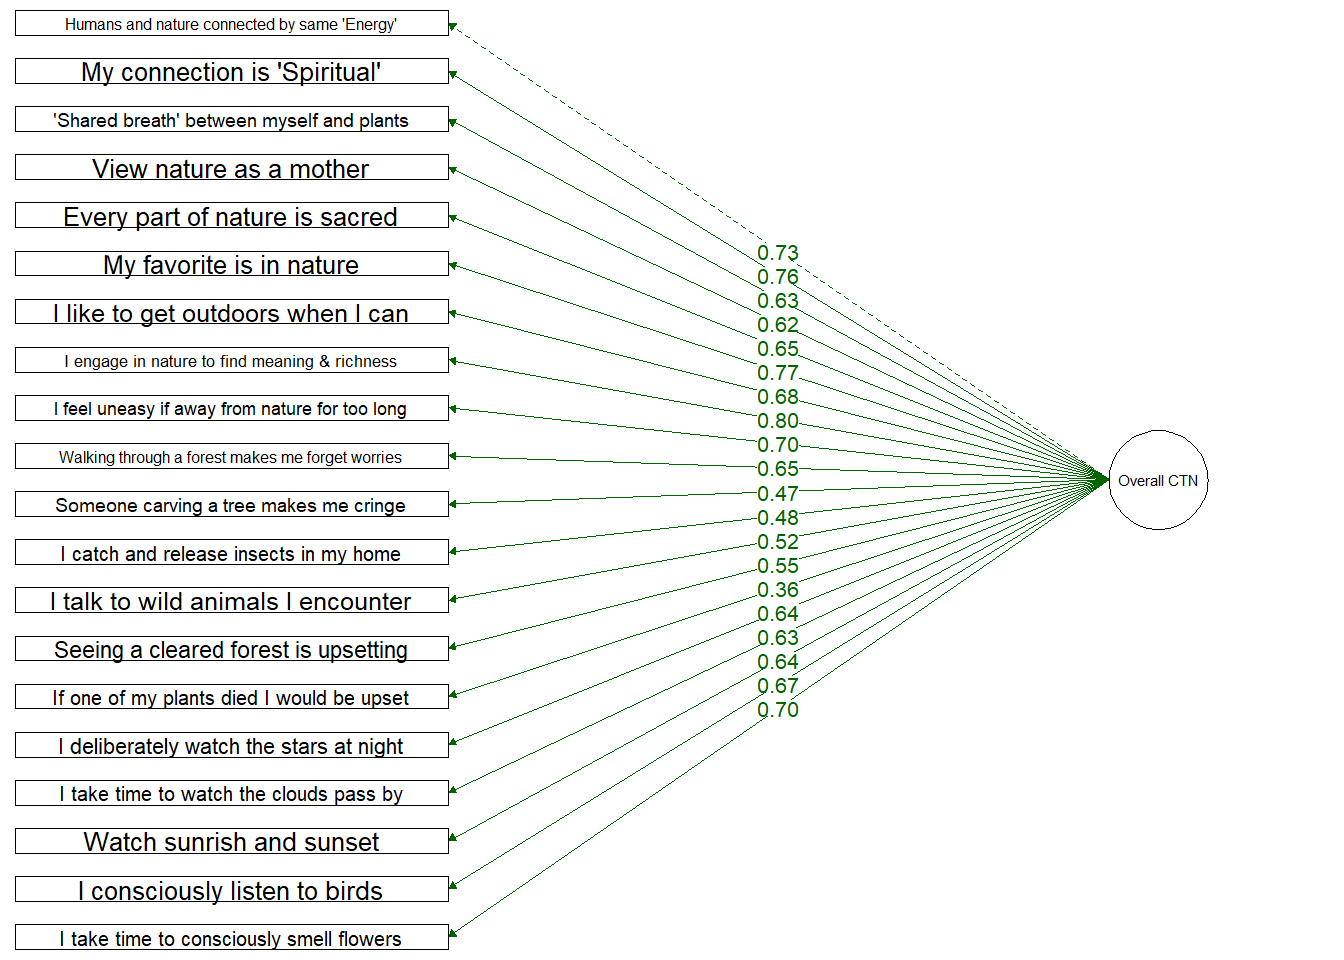
Table 4. Comparative Fit indices for each model - Reduced DEEP CTN Scale
Model | χ² (df)a | RMSEA (95% CI)b | RMSRc | TLId | CFIe | AICf |
|---|---|---|---|---|---|---|
Reduced 1-factor | 676.43 (170) | 0.11 (0.1 - 0.12) | 0.07 | 0.78 | 0.80 | 22,833.50 |
Reduced 4-factor hierachical | 358.4 (164) | 0.07 (0.06 - 0.08) | 0.05 | 0.91 | 0.93 | 22,446.42 |
Reduced 4-factor | 366.6 (166) | 0.07 (0.06 - 0.08) | 0.05 | 0.91 | 0.92 | 22,452.24 |
aChi-Square: Closer to 0 indicate better fit | ||||||
bRoot mean square error: 0.01 = Excellent; 0.05 = Good; 0.08 = Mediocre | ||||||
cStandardized root mean square residual: Closer to 0 indicate better fit | ||||||
dTucker Lewis Index: Closer to 1 indicates better fit | ||||||
eComparative fit index: Closer to 1 indicates better fit | ||||||
fAkaike’s Information Criterion: The lower the AIC, the more predictive | ||||||
An Analysis of Variance comparing the model fit of the four factor structures showed that there was 1. the reduced four-factor model provided a slightly better fit (Chi-sq= 450.122(166), p = .015).
- the reduced multi-dimensional models had significantly improved fit compared to the reduced unidimensional model (Chi-sq = 839.377(170), p = < .001).
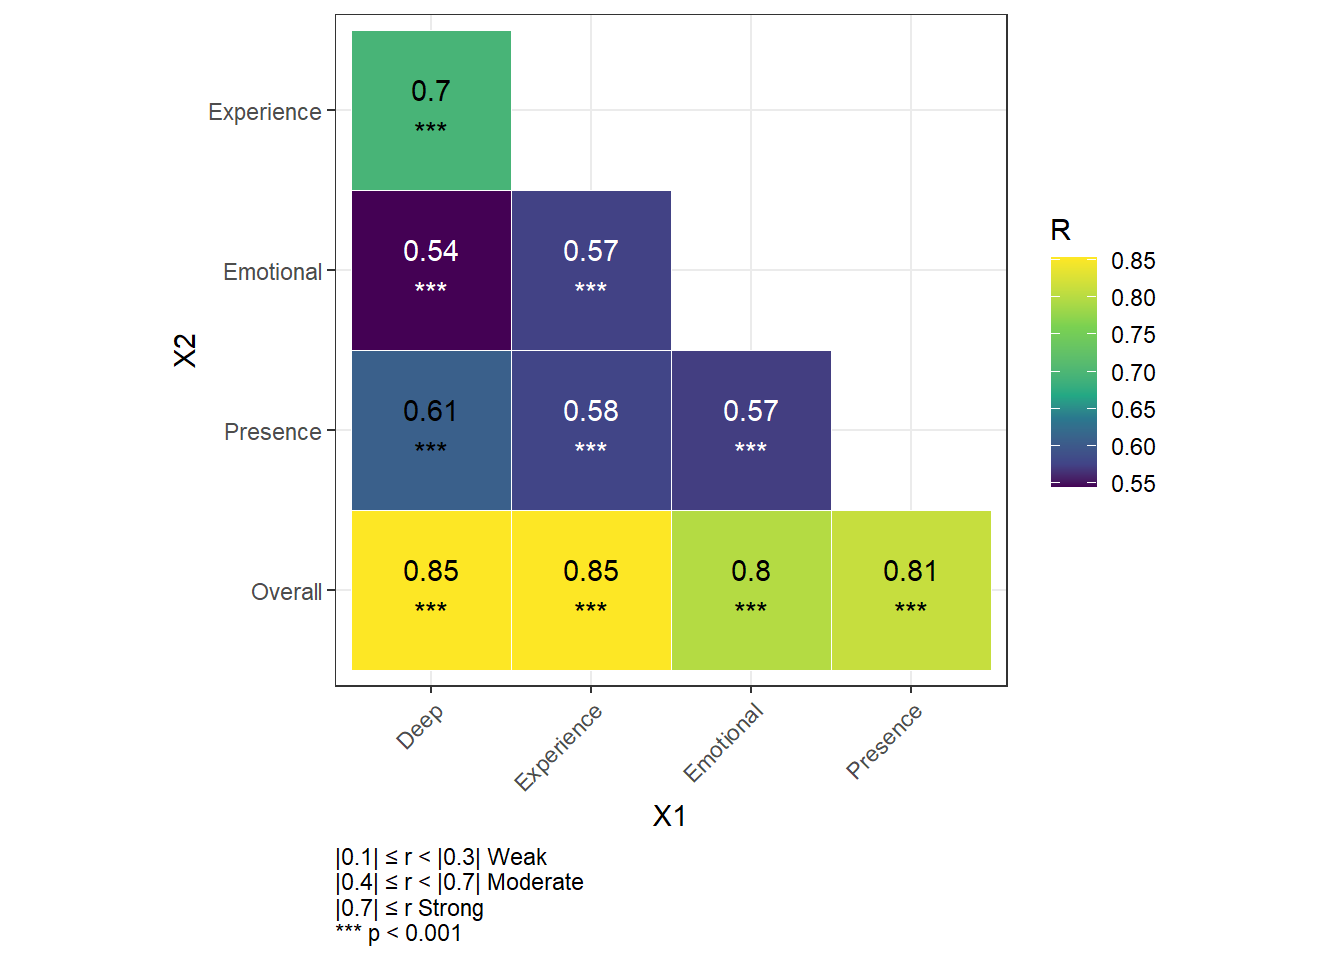
We also expected weak-to-moderate zero-order correlations between the four Deep CTN factors as they are predicted to be associated via one CTN construct (as would be supported by the hierarchical factor mentioned above). This was tested using a Zero-Order Correlation between the four factors. Figure 6. shows the inter-correlations between the factors revealing moderate relationships between all factors.
## Warning in lapply(X = X, FUN = FUN, ...): NAs introduced by coercion
Figure 6. Correlations between factors in the DEEP CTN Scale
Validation - SHORT SCALE
Final DEEP CTN Scale
Table 4 shows the Cronbach’s alpha for the reduced scale, which was acceptable for Deep, Experiential, and Presence, but showed a poor fit for the Emotional dimension.
Table 4. DEEP CTN Scale including the Cronbach’s Alpha for each factor
Item | CTN Subscale | Cronbach's Alpha |
|---|---|---|
I view nature as a mother who nurtures and cares for me | Deep | 0.86 |
Human beings and nature are connected by the same energy or Life-force | ||
My connection to nature is something I would describe as *spiritual* | ||
I think about the *shared breath* between myself and plants; I breathe in the oxygen released by plants, and plants use the carbon dioxide I exhale | ||
Every part of nature is sacred | ||
I like to get outdoors whenever I get the chance | Experience | 0.88 |
I feel uneasy if I am away from nature for too long | ||
I engage and participate with nature to find meaning and richness in life | ||
My favorite place is in nature | ||
Walking through a forest makes me forget about my daily worries | ||
Thinking of someone carving their initials into a tree makes me cringe | Emotional | 0.70 |
If there is an insect, such as a fly or a spider, in my home, I try to catch and release it rather than kill it | ||
I talk to the wild animals I encounter (e.g., birds, lizards, rabbits, squirrels) | ||
Seeing a cleared forest is upsetting to me | ||
If one of my plants died, I would be upset | ||
I take time to watch the clouds pass by | Presence | 0.87 |
I deliberately take time to watch stars at night | ||
I consciously watch or listen to birds | ||
I take time to consciously smell flowers | ||
I pay attention to the current phase of the moon |
## Warning: `as.tibble()` was deprecated in tibble 2.0.0.
## ℹ Please use `as_tibble()` instead.
## ℹ The signature and semantics have changed, see `?as_tibble`.
## This warning is displayed once every 8 hours.
## Call `lifecycle::last_lifecycle_warnings()` to see where this warning was
## generated.
vars | n | mean | sd | median | trimmed | mad | min | max | range | skew | kurtosis | se |
|---|---|---|---|---|---|---|---|---|---|---|---|---|
CTN_overall | 315 | 4.68 | 1.18 | 4.8 | 4.73 | 1.26 | 1.05 | 7 | 5.95 | -0.40 | -0.19 | 0.07 |
DeepCTN | 315 | 4.69 | 1.46 | 4.8 | 4.77 | 1.48 | 1.00 | 7 | 6.00 | -0.46 | -0.47 | 0.08 |
ExpCTN | 315 | 4.88 | 1.44 | 5.0 | 4.98 | 1.48 | 1.00 | 7 | 6.00 | -0.55 | -0.23 | 0.08 |
EmoCTN | 315 | 4.59 | 1.34 | 4.8 | 4.65 | 1.48 | 1.20 | 7 | 5.80 | -0.33 | -0.54 | 0.08 |
PresCTN | 315 | 4.56 | 1.37 | 4.8 | 4.63 | 1.48 | 1.00 | 7 | 6.00 | -0.44 | -0.37 | 0.08 |
##
## Cronbach's alpha for the 'reduced[, 1:20]' data-set
##
## Items: 20
## Sample units: 315
## alpha: 0.929
skew |
|---|
-1.00 |
-0.87 |
-0.85 |
-0.76 |
-0.76 |
-0.72 |
-0.63 |
-0.59 |
-0.47 |
-0.46 |
-0.41 |
-0.38 |
-0.31 |
-0.29 |
-0.28 |
-0.26 |
-0.23 |
-0.16 |
-0.14 |
-0.10 |
skew |
|---|
1.56 |
1.73 |
1.76 |
1.87 |
1.90 |
1.97 |
1.99 |
2.01 |
2.17 |
2.22 |
2.31 |
2.48 |
2.51 |
2.54 |
2.64 |
2.67 |
2.86 |
2.94 |
3.01 |
3.03 |
Hypothesis 2 - Convergent Validity
Our second hypothesis was that the Deep CTN scale would have convergent validity, which assesses how closely our new measure is related to other established measures of the same construct. We tested this by examining the correlations between two existing measures of CTN:
The Connectedness to Nature Scale (CNS - Mayer & Franz, 2004) (cronbach’s alpha = 0.82)
Environmental Identity Scale revised (EID-R - Clayton et al., 2021)(cronbach’s alpha = 0.93).
Hypothesis 2.A - CNS
We predicted that:
The Deep Identity facet of the DEEP CTN scale will strongly correlate with the CNS
The other three facets will only weakly-moderately correlate with the CNS
This is based on past research identifying the CNS as a uni-dimensional measure of nature connectedness which focuses on the cognitive aspect of connection to nature (Mayer & Frantz, 2004)
Hypothesis 2.B - EID-R
We similarly predicted that:
The Experience and Emotional facets of the DEEP CTN scale will strongly correlate with the EID-R
The Deep and Presence facets will weakly (or not at all) correlate.
This is based on previous research which identified multiple dimensions measuring enjoyment and appreciation of nature (Olivos & Aragones, 2011)
A zero-order Spearman correlation of the four Deep CTN scale facets, the CNS, and the EID-R found support for hypothesis 2A and partial support for hypothesis 2B tested (see Table).
Hypothesis 2A is supported as the Deep CTN scale factor correlated strongly with the CNS, while the other three factors only correlated moderately.
Hypothesis 2B is partially supported. While the experiential factor did correlate strongly with the EID-R,t he emotional factor only correlated moderately. Additionally, the deep and presence facets also correlated moderately.
Table 5. Spearman correlations between DEEP CTN facets and existing measures of CTN
Overall CTN | Deep | Experiential | Emotional | Presence | |
|---|---|---|---|---|---|
CNS | .72*** | .75*** | .62*** | .5*** | .53*** |
EIDR | .78*** | .63*** | .81*** | .58*** | .55*** |
Bold r values are the strongest factor correlation | |||||
Hypothesis 3 - Predictive Validity
Hypothesis 3.A - PEB
We assessed the predictive validity of the new DEEP CTN scale (i.e., how well our measure can predict participant scores on two theoretically related constructs). The “gold standard” for predictive validity of CTN measures is how well it predicts pro-environmental behavior (PEB) (Clayton, 2003; Clayton et al., 2021; Mayer & Frantz, 2004; Tam, 2013).
We predicted that the DEEP CTN scale and its factors would correlate moderately with PEB using the Recurring Pro-Environmental Scale (Brick et al., 2017)(cronbach’s alpha = 0.79). A zero-order correlation confirmed moderate correlations between the factors and PEB. However, we also predicted some variation of correlations between the facets such that some are stronger predictors than others. This was not supported as correlations ranged between r = 0.44 and r = 0.46 (See Table 6.)
Table 6 Spearman correlations between DEEP CTN factors and existing Pro-Environmental Behavior
Overall CTN | Deep | Experiential | Emotional | Presence | |
|---|---|---|---|---|---|
PEB | .53*** | .44*** | .44*** | .45*** | .46*** |
|0.1| ≤ r < |0.3| = Weak correlation | |||||
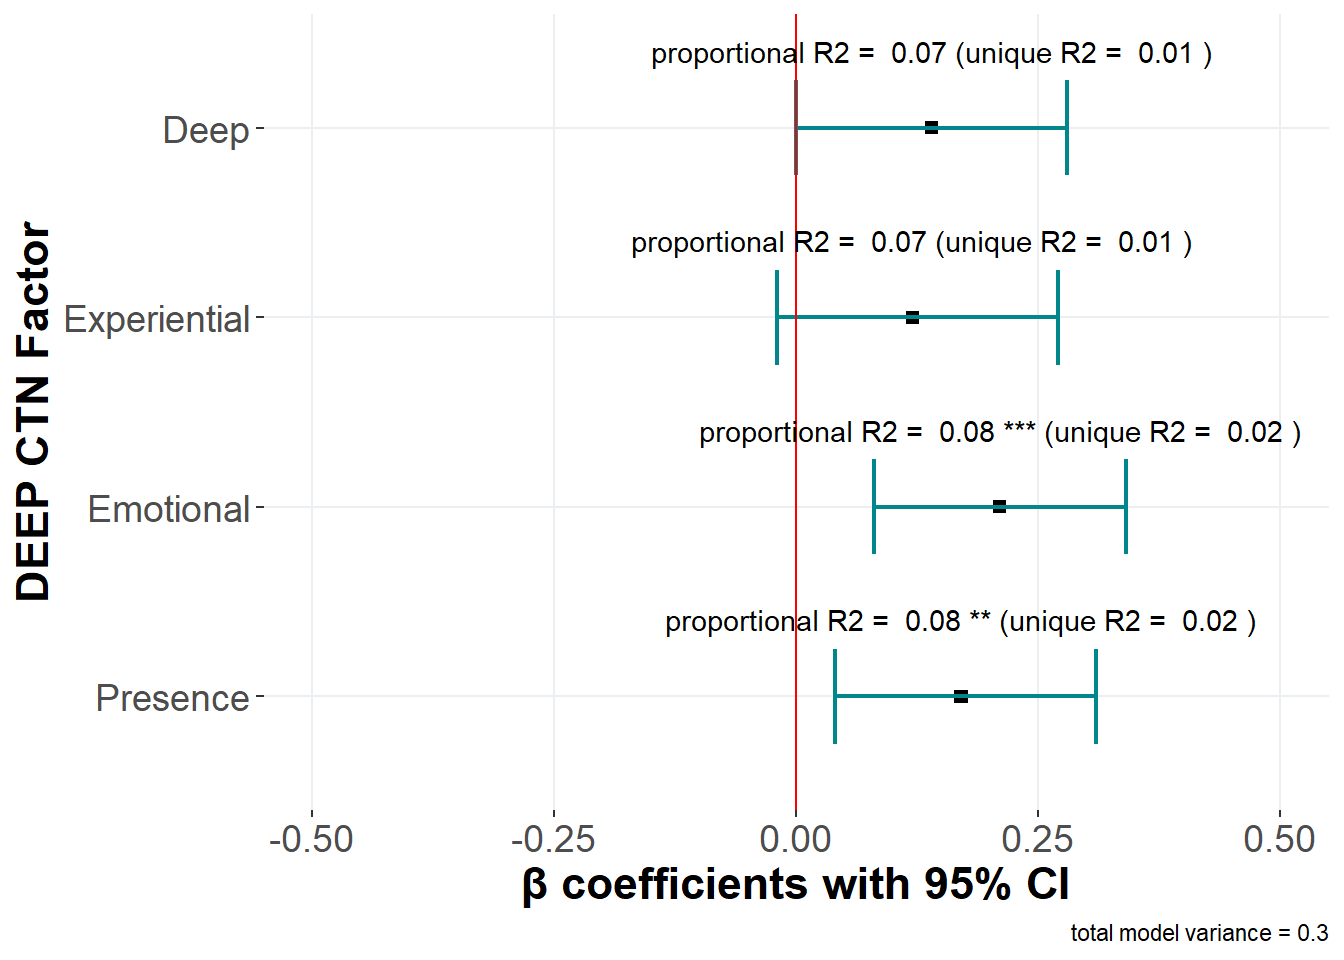
A linear regression predicting PEB from the four DEEP CTN factors explained 30% of the variance in the model. It showed that the emotional and presence factors explained a significant amount of unique variance in PEB (see Figure 6).
Figure 6. Effect sizes of DEEP CTN factors predicting Pro-environmental behavior
##
## Call:
## lm(formula = RPEBS_z ~ CNS_z, data = val_data)
##
## Residuals:
##      Min       1Q   Median       3Q      Max
## -2.48102 -0.58111  0.09038  0.58097  2.59671
##
## Coefficients:
##               Estimate Std. Error t value Pr(>|t|)
## (Intercept) -3.744e-16  5.007e-02   0.000        1
## CNS_z        4.614e-01  5.015e-02   9.201   <2e-16 ***
## ---
## Signif. codes:  0 '***' 0.001 '**' 0.01 '*' 0.05 '.' 0.1 ' ' 1
##
## Residual standard error: 0.8886 on 313 degrees of freedom
## Multiple R-squared:  0.2129,	Adjusted R-squared:  0.2104
## F-statistic: 84.66 on 1 and 313 DF,  p-value: < 2.2e-16
##
## Call:
## lm(formula = RPEBS_z ~ EIDR_z, data = val_data)
##
## Residuals:
##      Min       1Q   Median       3Q      Max
## -2.52149 -0.67030  0.04673  0.57314  2.31026
##
## Coefficients:
##              Estimate Std. Error t value Pr(>|t|)
## (Intercept) 4.545e-17  5.067e-02   0.000        1
## EIDR_z      4.404e-01  5.075e-02   8.677 2.26e-16 ***
## ---
## Signif. codes:  0 '***' 0.001 '**' 0.01 '*' 0.05 '.' 0.1 ' ' 1
##
## Residual standard error: 0.8993 on 313 degrees of freedom
## Multiple R-squared:  0.1939,	Adjusted R-squared:  0.1913
## F-statistic:  75.3 on 1 and 313 DF,  p-value: 2.256e-16
Hypothesis 3.B - Well-Being
Nature connectedness has also been shown to relate to various measures of psychological well-being (Capaldi et al., 2014; Pritchard et al., 2020). To measure well-being we used a composite measure from three established measures of well-being: 1) the Ryff Well-being Scale (Ryff & Keyes, 1995); 2) the positive affect sub-scale of the PANAS (Watson et al., 1988); and 3) the Subjective Vitality Scale (Ryan & Frederick, 1997). The Cronbach’s Alpha for this composite measure is 0.86.
We predicted that the DEEP CTN scale and its factors would correlate moderately with well-being. A zero-order correlation confirmed only weak-moderate correlations between the factors and well-being. Similarly to predicting PEB there as consistency across the factors to predict well-being. This countered our prediction that there would be variation among the factors to predict well-being, as correlations ranged between r = 0.17 and r = 0.42 (See Table 7.)
Table 7. Zero-order correlations between DEEP CTN factors and Well-being
Overall CTN | Deep | Experiential | Emotional | Presence | |
|---|---|---|---|---|---|
Well-being | .39*** | .42*** | .34*** | .17** | .39*** |
|0.1| ≤ r < |0.3| = Weak correlation | |||||
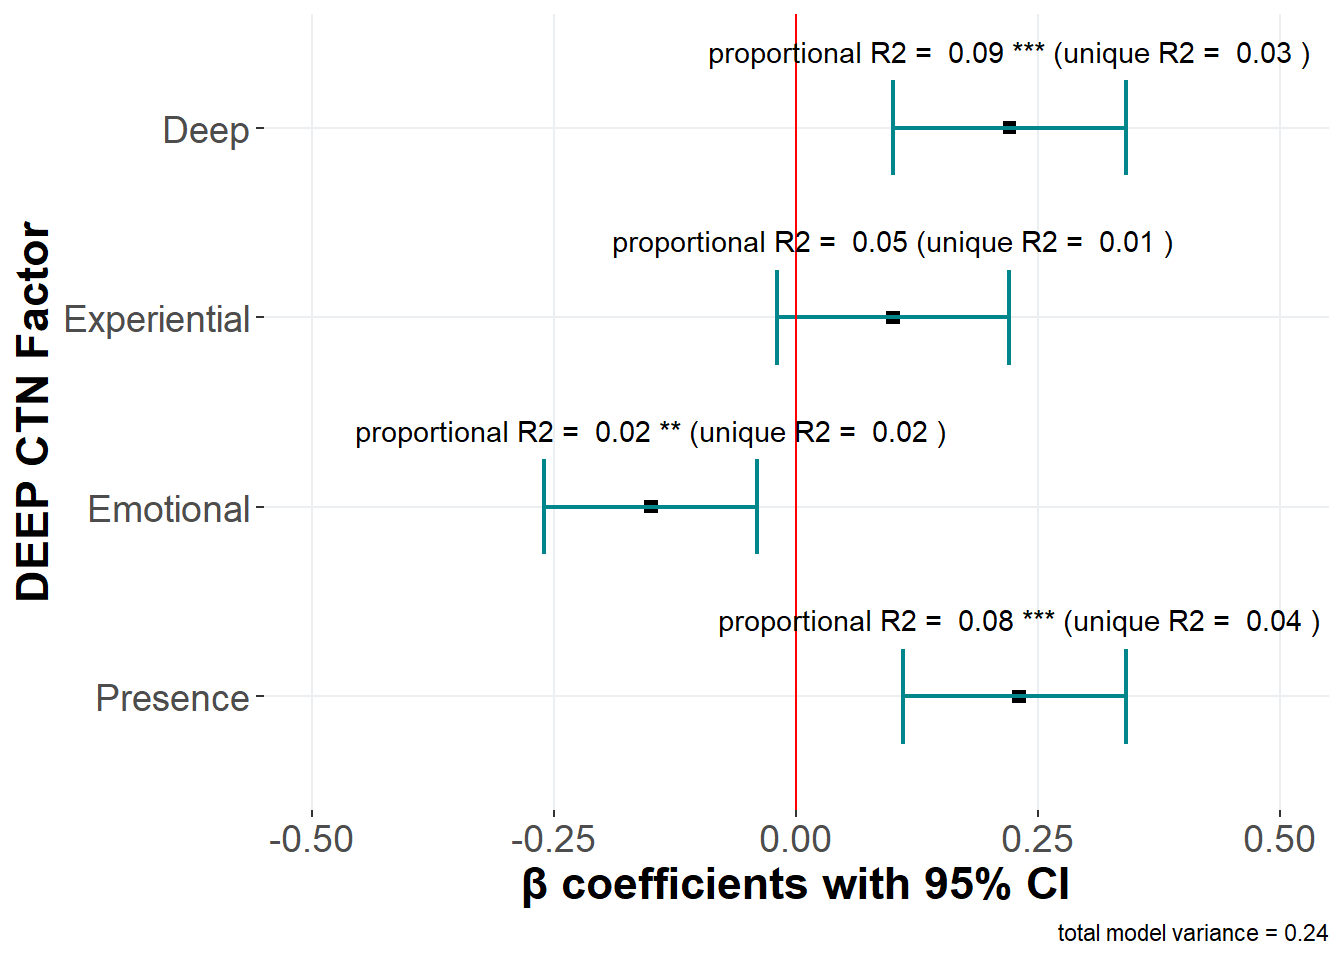
A linear regression predicting well-being from the four DEEP CTN factors accounted for 24% of the variance in the model. It showed that presence, deep, and emotional explained a unique amount of variance in well-being. Interestingly, while deep and presence factors showed a positive relationship with well-being, emotional CTN had a negative relationship (see Figure 7).
Figure 7. Linear regression predicting Well-being from ONLY DEEP CTN factors
##
## Call:
## lm(formula = WB ~ CNS_z, data = val_data)
##
## Residuals:
##      Min       1Q   Median       3Q      Max
## -1.82272 -0.46511  0.02877  0.47416  1.92149
##
## Coefficients:
##               Estimate Std. Error t value Pr(>|t|)
## (Intercept) -5.423e-16  4.002e-02   0.000        1
## CNS_z        3.951e-01  4.009e-02   9.856   <2e-16 ***
## ---
## Signif. codes:  0 '***' 0.001 '**' 0.01 '*' 0.05 '.' 0.1 ' ' 1
##
## Residual standard error: 0.7103 on 313 degrees of freedom
## Multiple R-squared:  0.2369,	Adjusted R-squared:  0.2344
## F-statistic: 97.14 on 1 and 313 DF,  p-value: < 2.2e-16
##
## Call:
## lm(formula = WB ~ EIDR_z, data = val_data)
##
## Residuals:
##      Min       1Q   Median       3Q      Max
## -2.31555 -0.52230  0.02568  0.46769  2.32681
##
## Coefficients:
##               Estimate Std. Error t value Pr(>|t|)
## (Intercept) -2.234e-16  4.289e-02    0.00        1
## EIDR_z       2.857e-01  4.295e-02    6.65  1.3e-10 ***
## ---
## Signif. codes:  0 '***' 0.001 '**' 0.01 '*' 0.05 '.' 0.1 ' ' 1
##
## Residual standard error: 0.7611 on 313 degrees of freedom
## Multiple R-squared:  0.1238,	Adjusted R-squared:  0.121
## F-statistic: 44.23 on 1 and 313 DF,  p-value: 1.304e-10
Hypothesis 4 - Incremental Validity
We explored if the DEEP CTN scale and its facets would perform above and beyond existing CTN scales (i.e., CNS and EID-R) when predicting PEB.
Hypothesis 4.A - PEB
We predicted that one or more of the factors of the DEEP CTN scale would be the strongest predictor of PEB compared to the CNS and the EID-R. A linear regression model predicting PEB from the four factors of the DEEP CTN scale and two existing CTN measures (CNS and EIDR). These were all entered simultaneously to determine the amount of unique variance each predictor accounted for. Note that because overall CTN was highly intercorrelated with the factors of the scale, it was left out and only the four dimensions were included.
The results of the linear regression to predict PEB support our prediction. When entered simultaneously into a regression model, both the emotional and presence factors of the DEEP CTN Scale stayed significant predictors of PEB at a corrected alpha to account for family-wise error (see Table 6.)
Table 6. Linear regression predicting PEB from DEEP CTN factors, CNS, and EID-R
Step 1 | Step 2 | |||||
|---|---|---|---|---|---|---|
Variable | Prop R2 (Unique R2) | p | std Beta (99% CI) | Prop R2 (Unique R2) | p | std Beta (99% CI) |
Deep | 0.07 ( 0.01 ) | 0.05 | 0.14 ( 0 - 0.28 ) | 0.04 ( 0 ) | 0.69 | 0.03 ( -0.13 - 0.2 ) |
Experiential | 0.07 ( 0.01 ) | 0.08 | 0.12 ( -0.02 - 0.27 ) | 0.04 ( 0 ) | 0.31 | 0.09 ( -0.09 - 0.28 ) |
Emotional | 0.08 ( 0.02 ) | 0.00 | 0.21 ( 0.08 - 0.34 ) | 0.07 ( 0.02 ) | 0.00 | 0.19 ( 0.07 - 0.32 ) |
Presence | 0.08 ( 0.02 ) | 0.01 | 0.17 ( 0.04 - 0.31 ) | 0.06 ( 0.01 ) | 0.02 | 0.16 ( 0.03 - 0.29 ) |
CNS | 0.06 ( 0.01 ) | 0.02 | 0.18 ( 0.02 - 0.34 ) | |||
EIDR | 0.04 ( 0 ) | 0.91 | 0.01 ( -0.17 - 0.19 ) | |||
Model R2 | 0.3 | 0.31 | ||||
Bold indicates significant p value and CI | ||||||
Hypothesis 4.B - Well-being
We also explored if the DEEP CTN scale and its facets would perform above and beyond existing CTN scales (i.e., CNS and EID-R) when predicting Well-being. We predicted that one or more of the factors of the DEEP CTN scale would be the strongest predictor of psychological well-being compared to the CNS and the EID-R. Similar to the regression to predict PEB, only the factors of CTN were entered in the model due to the high inter-correlation of the overall CTN measure with its own factors.
The results of the linear regression to predict well-being show that emotional and presence remain significant predictors at a correct alpha, however the deep CTN factor is no longer significant (see Table 7).
Table 7. Linear regression predicting Well-being from DEEP CTN factors, CNS, and EID-R
## New names:
## • `variable...1` -> `variable`
Step 1 | Step 2 | |||||
|---|---|---|---|---|---|---|
Variable | Prop R2 (Unique R2) | p | std Beta (99% CI) | Prop R2 (Unique R2)_2 | p | std Beta (99% CI) |
Deep | 0.09 ( 0.03 ) | 0.00 | 0.22 ( 0.1 - 0.34 ) | 0.05 ( 0 ) | 0.49 | 0.05 ( -0.09 - 0.18 ) |
Experiential | 0.05 ( 0.01 ) | 0.11 | 0.1 ( -0.02 - 0.22 ) | 0.03 ( 0 ) | 0.24 | 0.09 ( -0.06 - 0.24 ) |
Emotional | 0.02 ( 0.02 ) | 0.01 | -0.15 ( -0.26 - -0.04 ) | 0.02 ( 0.02 ) | 0.00 | -0.17 ( -0.27 - -0.06 ) |
Presence | 0.08 ( 0.04 ) | 0.00 | 0.23 ( 0.11 - 0.34 ) | 0.06 ( 0.03 ) | 0.00 | 0.2 ( 0.09 - 0.31 ) |
CNS | NA ( NA ) | 0.1 ( 0.05 ) | 0.00 | 0.31 ( 0.18 - 0.44 ) | ||
EIDR | NA ( NA ) | 0.03 ( 0 ) | 0.52 | -0.05 ( -0.2 - 0.1 ) | ||
Model R2 | 0.24 | 0.29 | ||||
Bold indicates significant p value and CI | ||||||
Hypothesis 5 - Robustness
We also tested the robustness of our new DEEP CTN scale, by testing if the DEEP CTN scale and its factors are significant predictors of both PEB & well-being after controlling for known covariates of these outcomes (e.g., interconnected world-views, political ideology, gender, age, and socio-economic status (SES)).
We fist inspected a zero order correlation to identify which covariates should be included. The decision to include variables is based on whether they are:
Strongly correlated with the outcome measure (PEB or Well-being) AND
Weakly correlated with the Deep CTN Scale
Do so would reduce variance in the outcome variable and therefore enhance the likelihood of seeing significant effects of the DEEP CTN scale.
Further, if an additional variable is:
Strongly correlated with BOTH the outcome variable (PEB or Well-being) AND
the Deep CTN Scale,
its inclusion in the model could address potential mediating effects regarding the relationship between the Deep CTN Scale and the outcome variable of interest. In either case this would suggest it’s important to include as a covariate.
This resulted in including the following when predicting PEB: - Worldviews - Age
As well as including the following when predicting well-being: - Worldviews - Politics - Age
Table 8. Zero-order correlations between DEEP CTN Scale factors and covariates
Overall CTN | Deep | Experiential | Emotional | Presence | PEB | Well-being | |
|---|---|---|---|---|---|---|---|
Worldviews | .46*** | .53*** | .35*** | .3*** | .35*** | .36*** | .37*** |
Politics | -.01 | .04 | .05 | -.14* | -.04 | -.04 | .2*** |
Age | .19*** | .13* | .15** | .06 | .27*** | .14* | .21*** |
Gender | .13* | .08 | .08 | .11 | .15* | .01 | .02 |
SES | .04 | .03 | .05 | -.01 | .06 | .21*** | .29*** |
|0.1| ≤ r < |0.3| = Weak correlation | |||||||
Hypothesis 5.A - PEB
We conducted a multiple linear regression model where dimensions of the DEEP CTN scale, worldviews, and age were entered simultaneously to predict PEB.
While interconnected worldviews explained a significant amount of unique variance, only the Emotional factor remained significant at a correct alpha to account for family-wise error (see Table 9). Including the covariates improved the fit of the model (F = 3.471(2), p = 0.032).
Table 9. Linear regression predicting PEB from DEEP CTN factors, Worldviews, and Age
Step 1 | Step 2 | |||||
|---|---|---|---|---|---|---|
Variable | Proportional R2 (Unique R2) | p | std Beta (99% CI) | Partial R2 | p | std Beta (99% CI) |
Deep | 0.07 ( 0.01 ) | 0.05 | 0.14 ( 0 - 0.28 ) | 0.06 | 0.36 | 0.07 ( -0.08 - 0.22 ) |
Experiential | 0.07 ( 0.01 ) | 0.08 | 0.12 ( -0.02 - 0.27 ) | 0.06 | 0.09 | 0.12 ( -0.02 - 0.26 ) |
Emotional | 0.08 ( 0.02 ) | 0.00 | 0.21 ( 0.08 - 0.34 ) | 0.08 | 0.00 | 0.22 ( 0.1 - 0.35 ) |
Presence | 0.08 ( 0.02 ) | 0.01 | 0.17 ( 0.04 - 0.31 ) | 0.07 | 0.04 | 0.14 ( 0.01 - 0.28 ) |
Worldviews | 0.04 | 0.01 | 0.14 ( 0.03 - 0.25 ) | |||
Age | 0.01 | 0.17 | 0 ( 0 - 0.01 ) | |||
Model R2 | 0.3 | 0.31 | ||||
Bold indicates significant p value and CI | ||||||
Hypothesis 5.B - Well-being
We conducted a multiple linear regression model where dimensions of the DEEP CTN scale and age were entered simultaneously to predict well-being.
While interconnected worldviews and political ideology explained a significant amount of unique variance, only the Presence factor remained significant at a correct alpha to account for family-wise error (see Table 10). Including the covariates improved the fit of the model (F = 11.272(3), p = 0).
Table 10. Linear regression predicting Well-being from DEEP CTN factors, Worldviews, Politics, and Age
Step 1 | Step 2 | |||||
|---|---|---|---|---|---|---|
Variable | Partial R2 | p | std Beta (99% CI) | Partial R2 | p | std Beta (99% CI) |
Deep | 0.09 | 0.00 | 0.22 ( 0.1 - 0.34 ) | 0.06 | 0.04 | 0.13 ( 0 - 0.25 ) |
Experiential | 0.05 | 0.11 | 0.1 ( -0.02 - 0.22 ) | 0.04 | 0.27 | 0.07 ( -0.05 - 0.18 ) |
Emotional | 0.02 | 0.01 | -0.15 ( -0.26 - -0.04 ) | 0.01 | 0.07 | -0.1 ( -0.2 - 0.01 ) |
Presence | 0.08 | 0.00 | 0.23 ( 0.11 - 0.34 ) | 0.07 | 0.00 | 0.19 ( 0.08 - 0.3 ) |
Worldviews | 0.07 | 0.00 | 0.18 ( 0.09 - 0.27 ) | |||
Politics | 0.04 | 0.00 | 0.14 ( 0.06 - 0.22 ) | |||
Age | 0.02 | 0.04 | 0.01 ( 0 - 0.01 ) | |||
Model R2 | 0.24 | 0.31 | ||||
Bold indicates significant p value and CI | ||||||