DEEP CTN CFA (Pilot 4 SONA Spr23)
Pilot data collected during the Spring quarter (2023) on SONA students. This was piloting the CFA that will be run on Prolific participants Jan 2024.
Participants
394 undergraduate students participated for course credit in May 2023. Thirty-one participants did not complete the study and twenty-two people failed to pass attention checks so their data was not analysed. The final analysis consisted of 341 participants with ages ranging from 18 - 42 (M = 20.88, 2.7). The sample was primarily made up of females (68.3%) and people of Asian ethnicity (42.1%). See the table below for full descriptives.
gender | n | Age(mean) | Age(sd) |
|---|---|---|---|
Man | 63 | 21.02 | 2.35 |
No Answer | 1 | 20.00 | |
NonBinary | 4 | 21.25 | 2.36 |
Other | 1 | 19.00 | |
TransMan | 2 | 19.00 | 0.00 |
TransWoman | 1 | 19.00 | |
Woman | 269 | 20.87 | 2.80 |
ethnoracial | n |
|---|---|
Asian | 166 |
Black | 5 |
Hispanic | 85 |
Middle Eastern | 16 |
Mixed | 24 |
No Answer | 3 |
White | 42 |
Political Ideology was scored on a 7-point Likert scale with 1 = Most Conservative and 7 = Most Liberal. The mean political ideology was 5.04(1.17), showing that this sample skewed more liberal. This is to be expected with our student sample. Family SES was scored on a 10-point ladder,with 10 being the best off, and 1 being the worst off. The mean SES was 6.3(1.72).
Method
Participants enrolled in undergraduate psychology courses signed up via SONA to participate in a short online study for course credit. They were directed to a Qualtrics survey where they were first prompted with the question “How would you define nature?”. After which they were presented with 30 CTN items. These were the CTN items selected after analysing the results from the EFA studies above. See [ADD LINK HERE] for a full list of CTN items.
Measures
Convergent Validity
Two pre-existing CTN scales were used to identify convergent validity. The Connectedenss to Nature Scale (CNS, Mayer & Frantz, 2004) and the Environmental Identity Scale revised (EID-R, Clayton et al., 2021). The CNS is a 14-item scale designed to measure the cognitive beliefs about how interneconnect one’s self is to nature. It is measured on a Likert scale ranging from 1(strongly disagree) to 5(strongly agree). The EID-R is a 14-item scale designed to measure how interneconnect one’s self is to nature. It is measured on a Likert scale ranging from 1(not at all true of me) to 7(completely true of me).
Predictive Validity
Pro-environmental behavior
Participants completed the Recurring Pro-environmental Behavior scale (Brick et al., 2017) which asks people to report how often they engage in various pro-environmental behaviors. This scale includes 20 items measured on a Likert scale ranging from 1(never) to 5(always).
Primal Beliefs
Three subscales of the primals beliefs inventory (Clifton et al., 2019) were used to identify worldviews held by participants. The About Me subscale consists of five questions asking how egocentric ones beliefs are (e.g., Whatever is happening around me often feels related to me or something I’ve done). The Hierarchical subscale consists of five questions exploring beliefs about the hierarchical nature of the world (e.g., Things are rarely equal. Most plants and animals, even people, are better or worse than one another.). The Interconnected subscale consists of four items asking how connected or atomistic one believes the world to be (e.g., Most things are basically unconnected and independent from each other [reversed]). All items are measured on a Likert scale ranging from 1(strongly disagree) to 6(strongly agree).
Covariates
Locus of Control
Participants completed a brief version of the Locus of Control Scale (Sapp & Harrod, 1993) which includes 9 items revealing how much people perceived they have internal control over events (e.g., To a great extent, my life is controlled by accidental happenings). Measured on a Likert scale from 1(strongly disagree) to 7(strongly agree).
Demographics
Participants also answered several demographics questions (age, gender, political ideology, and social economic status).
Analysis & Results
CFA Assumptions
Several assumptions need to be met before running a confirmatory factor analysis. First we checked the skewedness and kurtosis of each item to be included in the CFA. The closer to zero for both skewedness and kurtosis, the closer to a normal distribution. Any items whose distributions exhibited skewness and/or kurtosis that exceed general guidelines were considered non-normal removed from the analysis (Hair et al., 2017, p. 61). Statology Link).
Skewness
For skewedness, using the skewness function from the Moments package in R (Komsta & Novemstky, 2015), skewness was calculated for each item. Any item where the number is greater than +1 (right skewed) or lower than -1 (left skewed), this is an indication of a substantially skewed distribution. No items were heavily skewed in this dataset.
## [1] "No items were heavily skewed"
## [1] skew
## <0 rows> (or 0-length row.names)
Kurtosis
For Kurtosis, using the kurtosis function from the Moments package in R (Komsta & Novemstky, 2015), kurtosis was calculated for each item. Any item were the number is greater than +3, the distribution is too peaked. Likewise, a kurtosis of less than -3 indicates a distribution that is too flat. Two items have a high kurtosis:
items | kurtosis |
|---|---|
DEEPCTN_s_5 | 3.32 |
DEEPCTN_ex_7 | 3.21 |
Inter-item Correlation
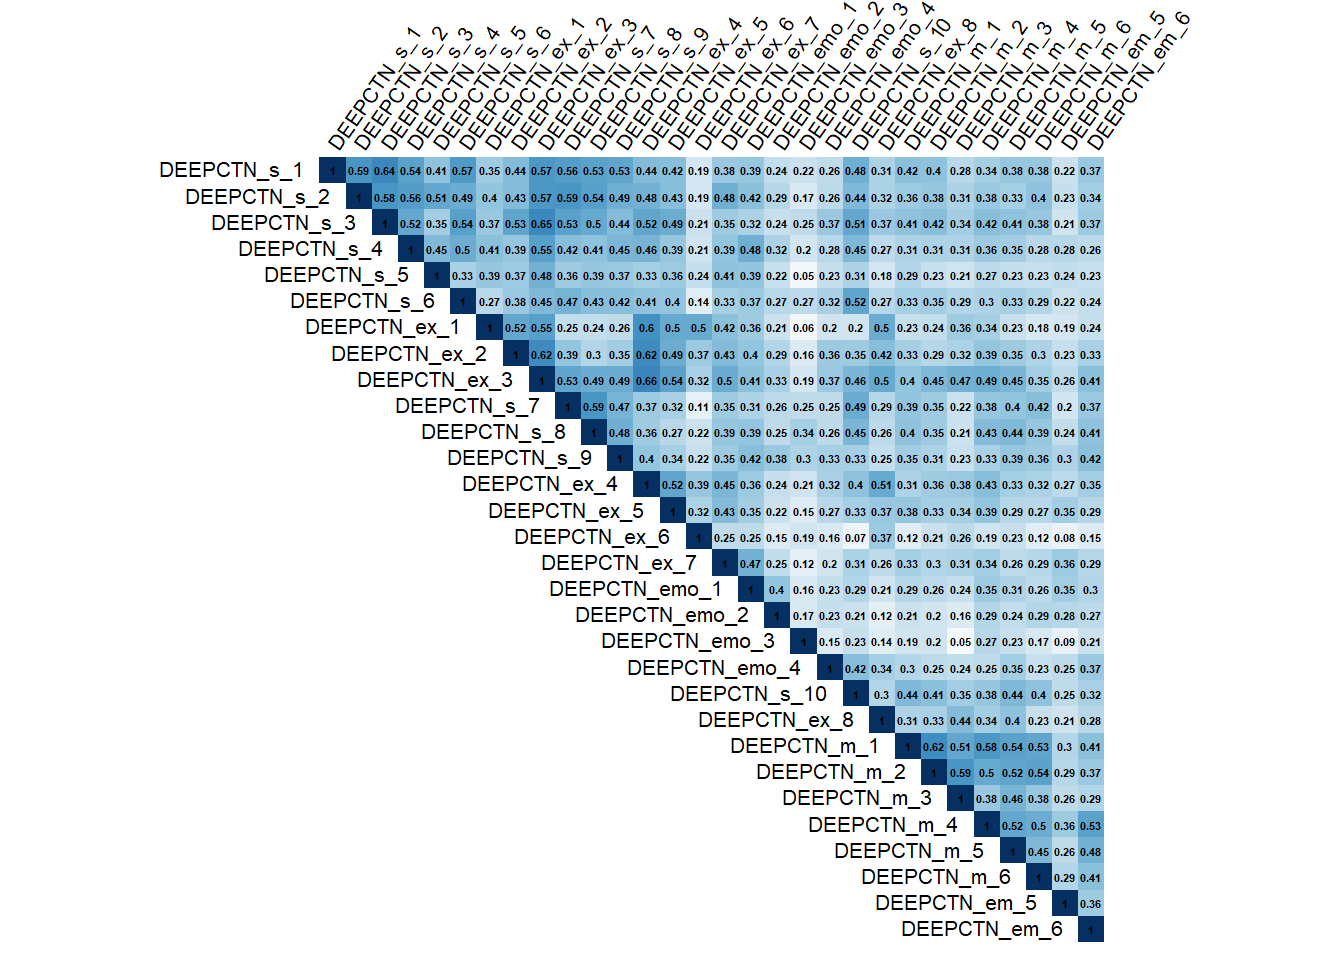
## [1] "No items were correlated > .75"
Multivariate normality
Notes on Multivariate Normality
- Quantiative test of normality: shapiro is fine for univariate normality test. But I also need to test for multivariate normality. This package is both. Use this.
- Can just look at univariate for now, but REPEAT THIS with my final variables to check for multivariate normality
- Sources:
A Mardia Test of multivariate normality from the MVN package in R (Korkmaz et al., 2021) indicated that this data is not normal, suggesting that a rotation-method that is robust to non-normal data should be used.
Multivariate Normality
Test | Statistic | p | Result |
|---|---|---|---|
Mardia Skewness | 7,681.36 | < 0.001 | NO |
Mardia Kurtosis | 28.32 | < 0.001 | NO |
MVN | NA | NO |
Univariate Normality
##            Test      Variable Statistic   p value Normality
## 1  Shapiro-Wilk  DEEPCTN_s_1     0.9402  <0.001      NO
## 2  Shapiro-Wilk  DEEPCTN_s_2     0.9326  <0.001      NO
## 3  Shapiro-Wilk  DEEPCTN_s_3     0.9175  <0.001      NO
## 4  Shapiro-Wilk  DEEPCTN_s_4     0.9245  <0.001      NO
## 5  Shapiro-Wilk  DEEPCTN_s_5     0.8833  <0.001      NO
## 6  Shapiro-Wilk  DEEPCTN_s_6     0.9263  <0.001      NO
## 7  Shapiro-Wilk DEEPCTN_ex_1     0.9230  <0.001      NO
## 8  Shapiro-Wilk DEEPCTN_ex_2     0.9443  <0.001      NO
## 9  Shapiro-Wilk DEEPCTN_ex_3     0.9446  <0.001      NO
## 10 Shapiro-Wilk  DEEPCTN_s_7     0.9324  <0.001      NO
## 11 Shapiro-Wilk  DEEPCTN_s_8     0.9402  <0.001      NO
## 12 Shapiro-Wilk  DEEPCTN_s_9     0.9255  <0.001      NO
## 13 Shapiro-Wilk DEEPCTN_ex_4     0.9409  <0.001      NO
## 14 Shapiro-Wilk DEEPCTN_ex_5     0.9331  <0.001      NO
## 15 Shapiro-Wilk DEEPCTN_ex_6     0.9256  <0.001      NO
## 16 Shapiro-Wilk DEEPCTN_ex_7     0.8912  <0.001      NO
## 17 Shapiro-Wilk DEEPCTN_emo_1    0.8987  <0.001      NO
## 18 Shapiro-Wilk DEEPCTN_emo_2    0.9163  <0.001      NO
## 19 Shapiro-Wilk DEEPCTN_emo_3    0.9262  <0.001      NO
## 20 Shapiro-Wilk DEEPCTN_emo_4    0.8586  <0.001      NO
## 21 Shapiro-Wilk DEEPCTN_s_10     0.9390  <0.001      NO
## 22 Shapiro-Wilk DEEPCTN_ex_8     0.9355  <0.001      NO
## 23 Shapiro-Wilk  DEEPCTN_m_1     0.9358  <0.001      NO
## 24 Shapiro-Wilk  DEEPCTN_m_2     0.9380  <0.001      NO
## 25 Shapiro-Wilk  DEEPCTN_m_3     0.9183  <0.001      NO
## 26 Shapiro-Wilk  DEEPCTN_m_4     0.9459  <0.001      NO
## 27 Shapiro-Wilk  DEEPCTN_m_5     0.9398  <0.001      NO
## 28 Shapiro-Wilk  DEEPCTN_m_6     0.9329  <0.001      NO
## 29 Shapiro-Wilk DEEPCTN_em_5     0.8499  <0.001      NO
## 30 Shapiro-Wilk DEEPCTN_em_6     0.8968  <0.001      NO
Norm Descriptives for each item
##            Test      Variable Statistic   p value Normality
## 1  Shapiro-Wilk  DEEPCTN_s_1     0.9402  <0.001      NO
## 2  Shapiro-Wilk  DEEPCTN_s_2     0.9326  <0.001      NO
## 3  Shapiro-Wilk  DEEPCTN_s_3     0.9175  <0.001      NO
## 4  Shapiro-Wilk  DEEPCTN_s_4     0.9245  <0.001      NO
## 5  Shapiro-Wilk  DEEPCTN_s_5     0.8833  <0.001      NO
## 6  Shapiro-Wilk  DEEPCTN_s_6     0.9263  <0.001      NO
## 7  Shapiro-Wilk DEEPCTN_ex_1     0.9230  <0.001      NO
## 8  Shapiro-Wilk DEEPCTN_ex_2     0.9443  <0.001      NO
## 9  Shapiro-Wilk DEEPCTN_ex_3     0.9446  <0.001      NO
## 10 Shapiro-Wilk  DEEPCTN_s_7     0.9324  <0.001      NO
## 11 Shapiro-Wilk  DEEPCTN_s_8     0.9402  <0.001      NO
## 12 Shapiro-Wilk  DEEPCTN_s_9     0.9255  <0.001      NO
## 13 Shapiro-Wilk DEEPCTN_ex_4     0.9409  <0.001      NO
## 14 Shapiro-Wilk DEEPCTN_ex_5     0.9331  <0.001      NO
## 15 Shapiro-Wilk DEEPCTN_ex_6     0.9256  <0.001      NO
## 16 Shapiro-Wilk DEEPCTN_ex_7     0.8912  <0.001      NO
## 17 Shapiro-Wilk DEEPCTN_emo_1    0.8987  <0.001      NO
## 18 Shapiro-Wilk DEEPCTN_emo_2    0.9163  <0.001      NO
## 19 Shapiro-Wilk DEEPCTN_emo_3    0.9262  <0.001      NO
## 20 Shapiro-Wilk DEEPCTN_emo_4    0.8586  <0.001      NO
## 21 Shapiro-Wilk DEEPCTN_s_10     0.9390  <0.001      NO
## 22 Shapiro-Wilk DEEPCTN_ex_8     0.9355  <0.001      NO
## 23 Shapiro-Wilk  DEEPCTN_m_1     0.9358  <0.001      NO
## 24 Shapiro-Wilk  DEEPCTN_m_2     0.9380  <0.001      NO
## 25 Shapiro-Wilk  DEEPCTN_m_3     0.9183  <0.001      NO
## 26 Shapiro-Wilk  DEEPCTN_m_4     0.9459  <0.001      NO
## 27 Shapiro-Wilk  DEEPCTN_m_5     0.9398  <0.001      NO
## 28 Shapiro-Wilk  DEEPCTN_m_6     0.9329  <0.001      NO
## 29 Shapiro-Wilk DEEPCTN_em_5     0.8499  <0.001      NO
## 30 Shapiro-Wilk DEEPCTN_em_6     0.8968  <0.001      NO
CFA Preparation
Only items that were decided upon during EFA pilots to be concluded
Remove items with too heavy kurtosis (see above)
All analyses going forward will only include the following items:
Code | Items |
|---|---|
DEEPCTN_s_1 | I view nature as a mother who nurtures and cares for me |
DEEPCTN_s_2 | Human beings and nature are connected by the same *energy* or *Life-force* |
DEEPCTN_s_3 | My connection to nature is something I would describe as *spiritual* |
DEEPCTN_s_7 | I think about the *shared breath* between myself and plants; I breathe in the oxygen released by plants, and plants use the carbon dioxide I exhale |
DEEPCTN_s_10 | When I eat, I feel thankful for the animals, plants, and earth for nourishing me |
DEEPCTN_s_8 | I often think about the fact that all life is grounded on this planet that is revolving around the sun |
DEEPCTN_s_4 | Every part of nature is sacred |
DEEPCTN_s_6 | I like the idea that, when I die, my body will return to the earth, nourishing the soil |
DEEPCTN_s_9 | Indoor plants are part of the family |
DEEPCTN_ex_4 | My favorite place is in nature |
DEEPCTN_ex_5 | Walking through a forest makes me forget about my daily worries |
DEEPCTN_ex_6 | I prefer outdoor to indoor sports |
DEEPCTN_ex_8 | I hike or run in nearby nature |
DEEPCTN_ex_1 | I like to get outdoors whenever I get the chance |
DEEPCTN_ex_2 | I feel uneasy if I am away from nature for too long |
DEEPCTN_ex_3 | I engage and participate with nature to find meaning and richness in life |
DEEPCTN_m_1 | I take time to watch the clouds pass by |
DEEPCTN_m_2 | I deliberately take time to watch stars at night |
DEEPCTN_m_3 | When possible I take time to watch the sunrise or the sunset without distractions |
DEEPCTN_m_4 | I consciously watch or listen to birds |
DEEPCTN_m_5 | I take time to consciously smell flowers |
DEEPCTN_m_6 | I pay attention to the current phase of the moon |
DEEPCTN_emo_1 | Seeing a cleared forest is upsetting to me |
DEEPCTN_emo_2 | If one of my plants died, I would blame myself |
DEEPCTN_emo_3 | Thinking of someone carving their initials into a tree makes me cringe |
DEEPCTN_emo_4 | If there is an insect, such as a fly or a spider, in my home, I try to catch and release it rather than kill it |
DEEPCTN_em_6 | I talk to the wild animals I encounter (e.g., birds, lizards, rabbits, squirrels) |
CFA
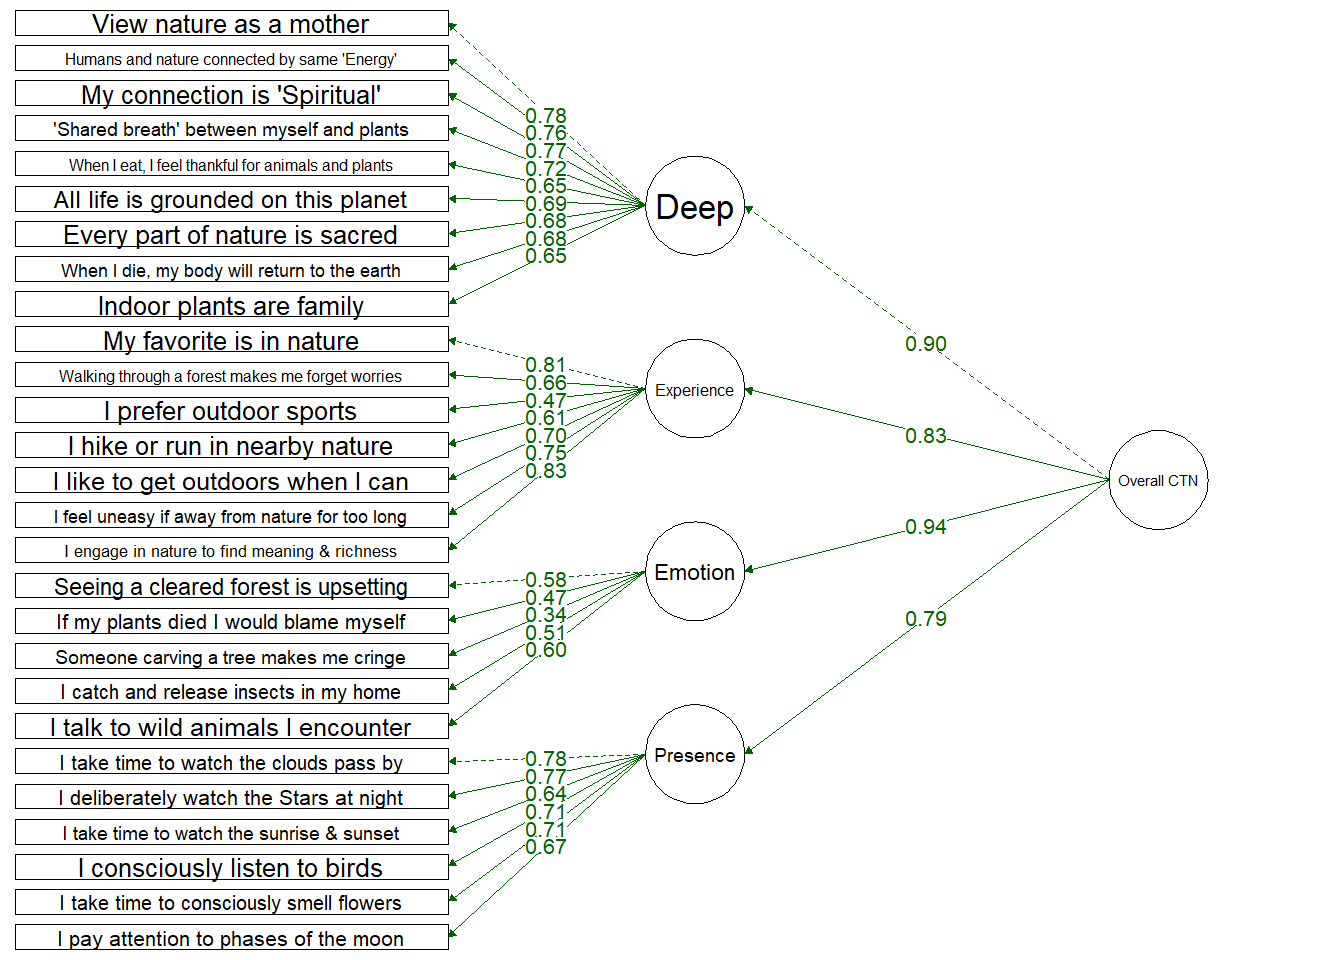
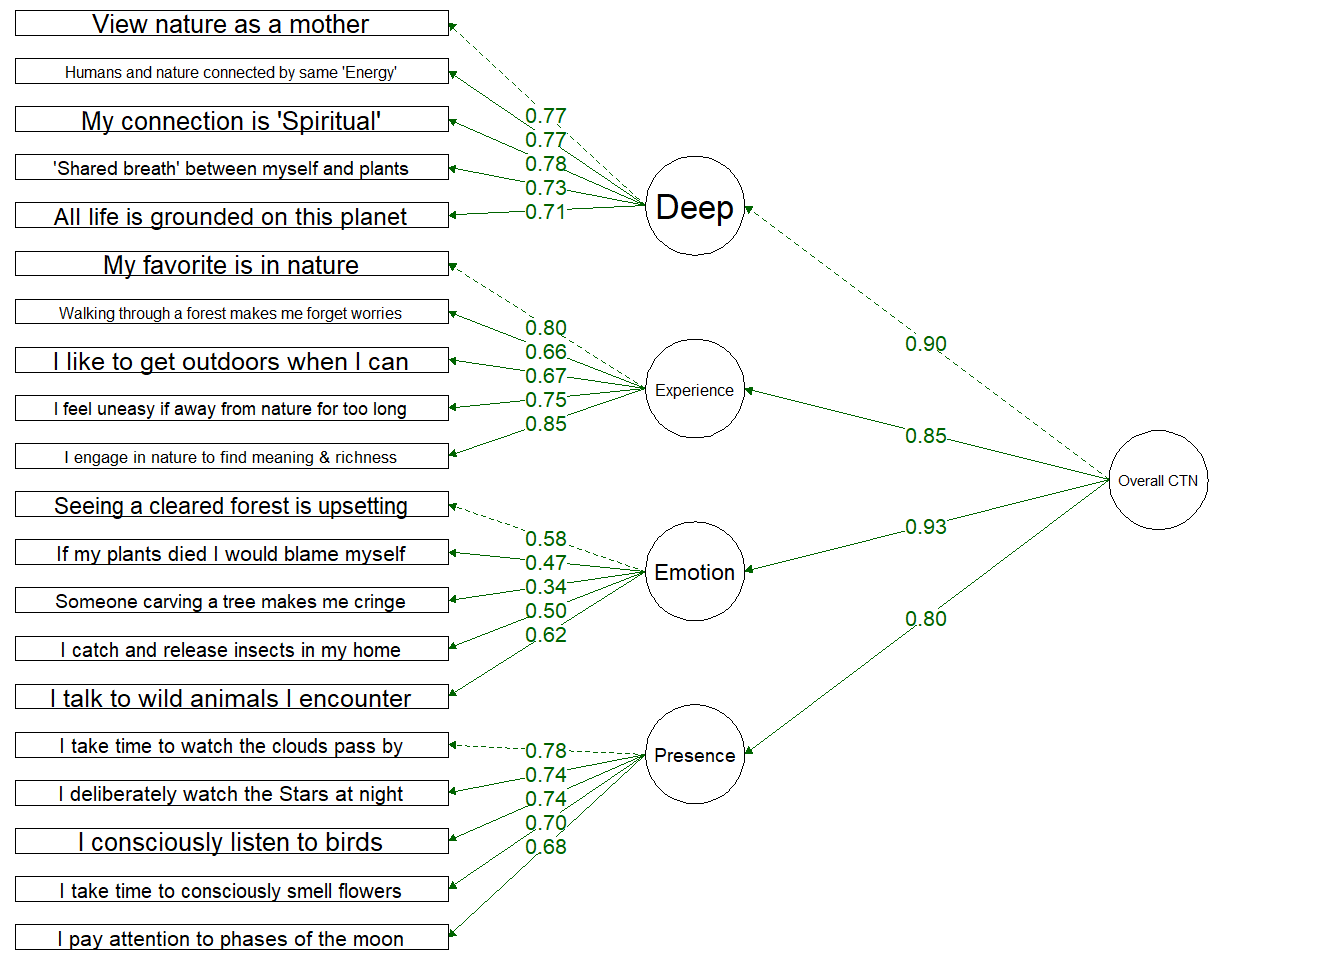
Four Factor Hierarchical Model
Testing a structure which includes an overall Connection to Nature factor and four dimensions:
Deep: Deeply seeing the self as part of nature
Experiential: Spending more time in nature and enjoying spending time in nature
Emotional: Emotional desire to connect with nature and protect it
Presence: Engaging mindfully and consciously with nature
Items load onto their dimensions well, with the exception of 1 item (“Thinking of someone carving their initials into a tree makes me cringe”) which loaded onto the Emotion dimension at 0.33.
All dimensions loaded onto the single CTN dimension, but these loaded quite highly (especially Deep and Emotion) which suggests these might be driving the overall CTN score.
Fit Indices | df | Chi-Sqa | RMSEAb | RMSEA CI Lower | RMSEA CI Upper | SRMRc | TLId | CFIe | AICf |
|---|---|---|---|---|---|---|---|---|---|
320 | 757.665 | 0.064 | 0.058 | 0.07 | 0.058 | 0.887 | 0.897 | 31,855.45 | |
aCloser to 0 indicate better fit | |||||||||
b(Root mean square error) 0.01 = Excellent; 0.05 = Good; 0.08 = Mediocre | |||||||||
c(Standardized root mean square residual) Closer to 0 indicate better fit | |||||||||
d(Tucker Lewis Index) Closer to 1 indicates better fit | |||||||||
e(Comparative fit index) Closer to 1 indicates better fit | |||||||||
f(Akaike’s Information Criterion) The lower the AIC, the more predictive | |||||||||
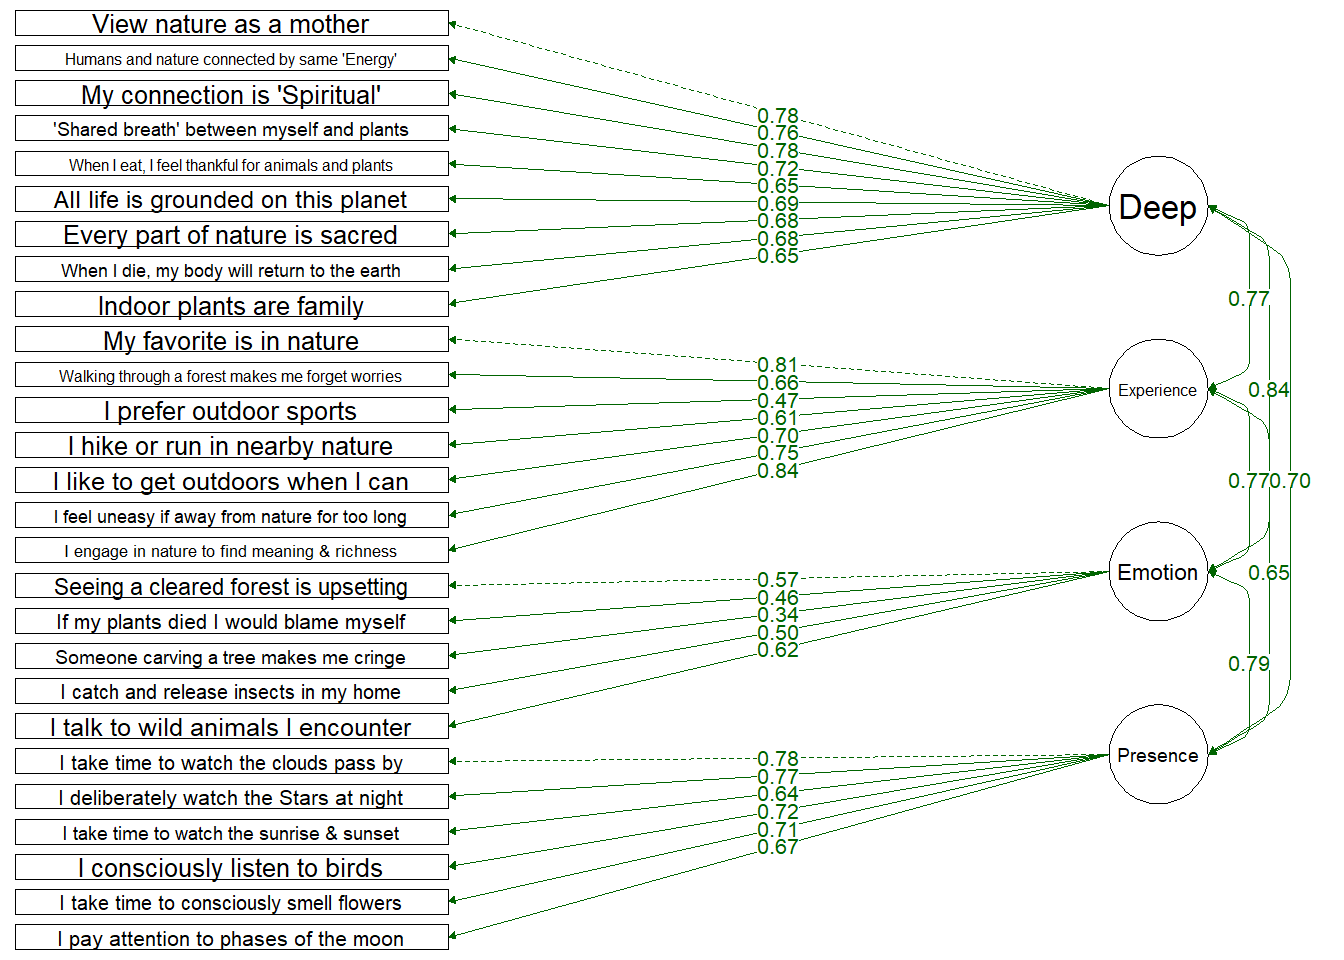
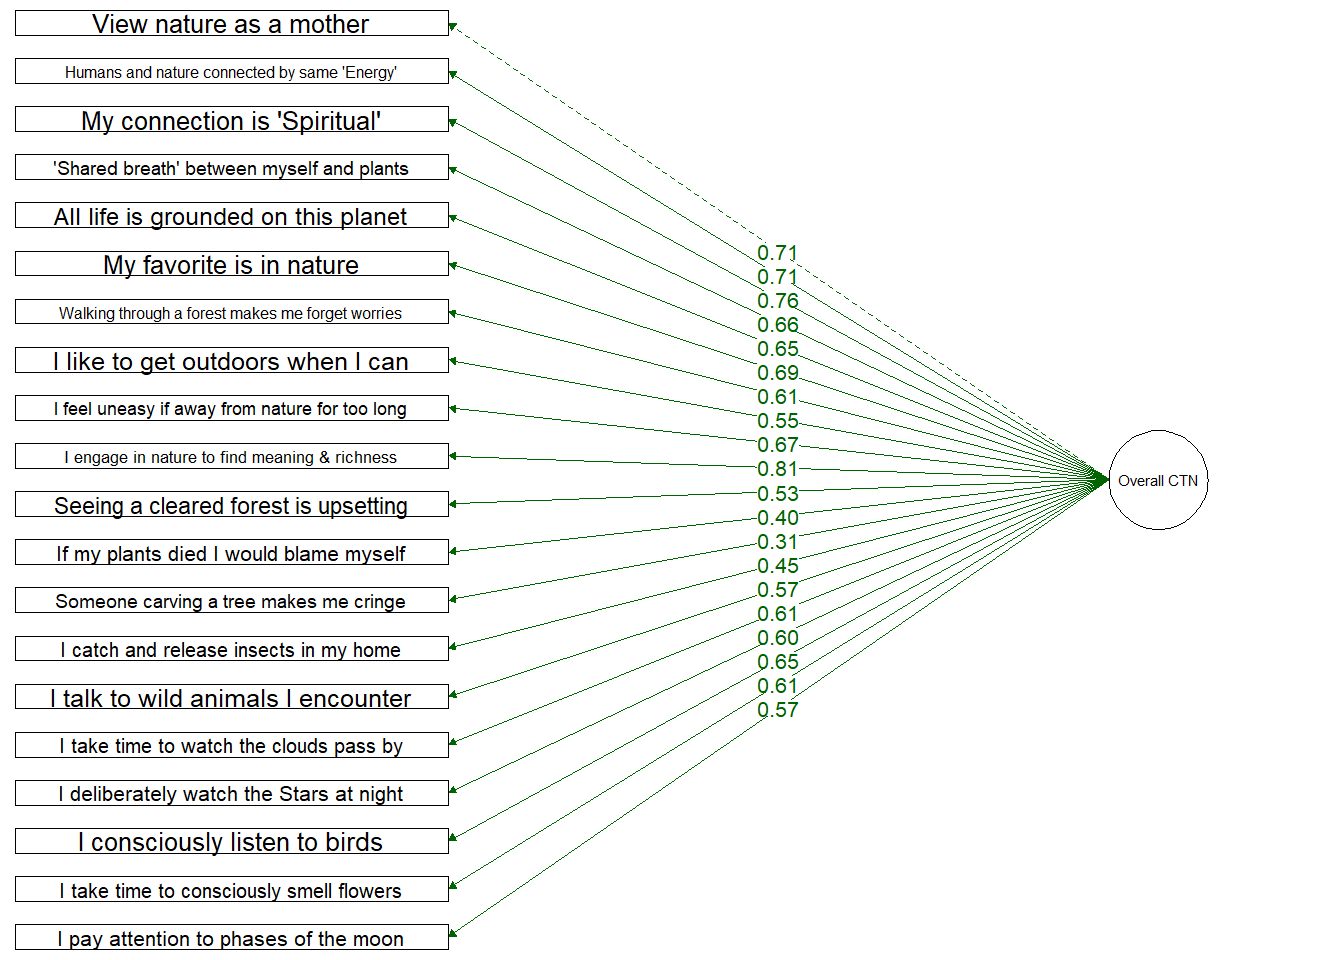
Four Factor Model
Testing a structure which only includes the four dimensions:
Deep: Deeply seeing the self as part of nature
Experiential: Spending more time in nature and enjoying spending time in nature
Emotional: Emotional desire to connect with nature and protect it
Presence: Engaging mindfully and consciously with nature
Items load onto their dimensions similarly well to the hierarchical model. Again, 1 item loads weakly: (“Thinking of someone carving their initials into a tree makes me cringe”) which loaded onto the Emotion dimension at 0.33.
Dimensions are intercorrelated reasonable well - not too high as to have multi-collinearity (none above .80)
Fit Indices | df | Chi-Sqa | RMSEAb | RMSEA CI Lower | RMSEA CI Upper | SRMRc | TLId | CFIe | AICf |
|---|---|---|---|---|---|---|---|---|---|
318 | 754.331 | 0.064 | 0.058 | 0.07 | 0.058 | 0.887 | 0.898 | 31,856.11 | |
aCloser to 0 indicate better fit | |||||||||
b(Root mean square error) 0.01 = Excellent; 0.05 = Good; 0.08 = Mediocre | |||||||||
c(Standardized root mean square residual) Closer to 0 indicate better fit | |||||||||
d(Tucker Lewis Index) Closer to 1 indicates better fit | |||||||||
e(Comparative fit index) Closer to 1 indicates better fit | |||||||||
f(Akaike’s Information Criterion) The lower the AIC, the more predictive | |||||||||
Single Factor Model
Testing a structure which includes only a single overall Connection to Nature factor
Loadings are slightly weaker onto a single overall CTN factor. Again, 1 item loads weakly: (“Thinking of someone carving their initials into a tree makes me cringe”) which loaded onto the Emotion dimension at 0.31.
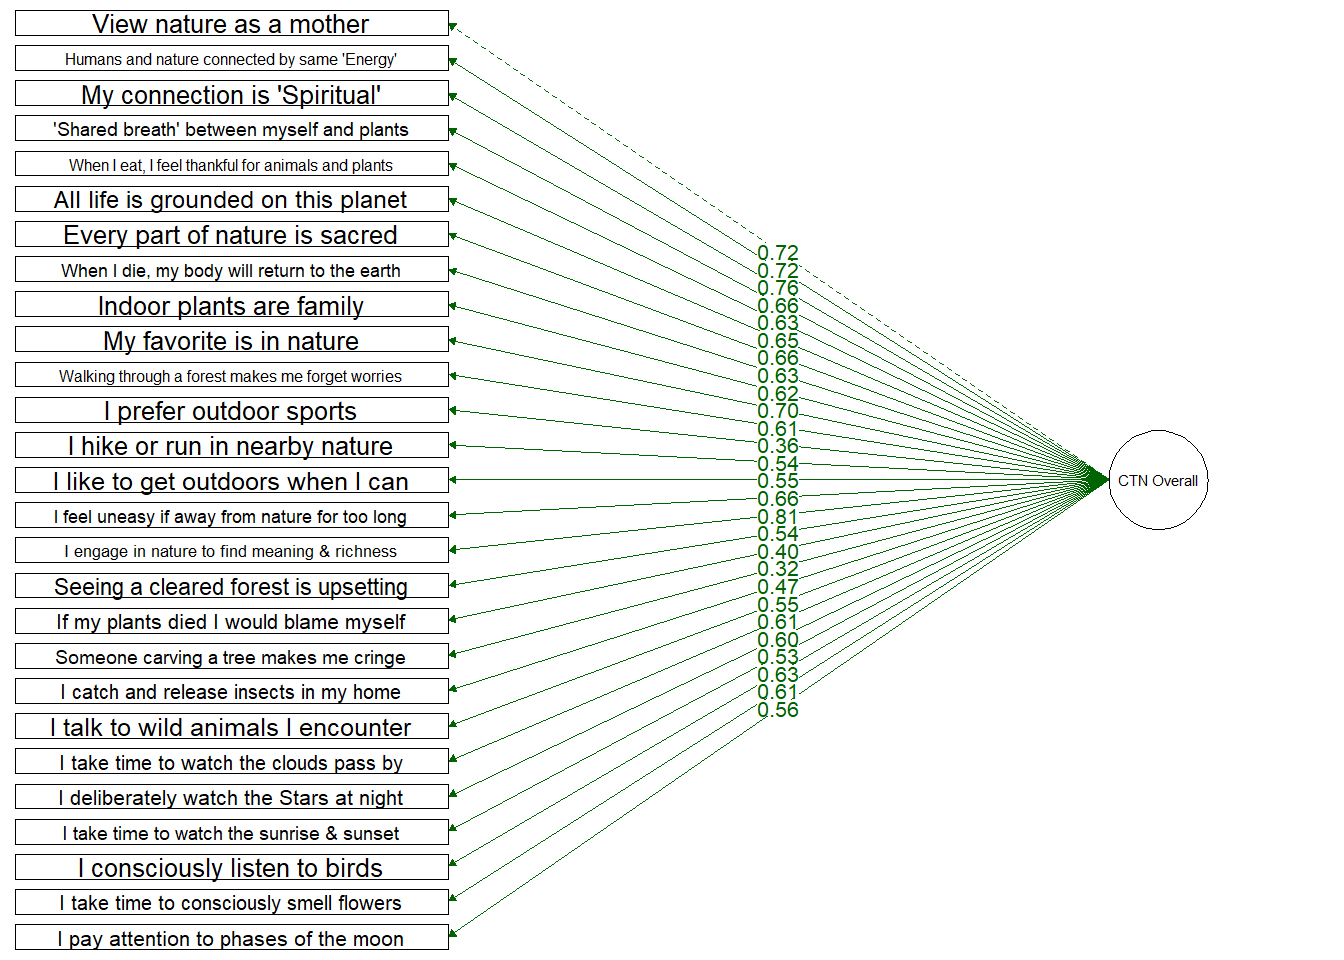
Fit Indices | df | Chi-Sqa | RMSEAb | RMSEA CI Lower | RMSEA CI Upper | SRMRc | TLId | CFIe | AICf |
|---|---|---|---|---|---|---|---|---|---|
324 | 1,291.895 | 0.095 | 0.089 | 0.1 | 0.075 | 0.754 | 0.773 | 32,381.68 | |
aCloser to 0 indicate better fit | |||||||||
b(Root mean square error) 0.01 = Excellent; 0.05 = Good; 0.08 = Mediocre | |||||||||
c(Standardized root mean square residual) Closer to 0 indicate better fit | |||||||||
d(Tucker Lewis Index) Closer to 1 indicates better fit | |||||||||
e(Comparative fit index) Closer to 1 indicates better fit | |||||||||
f(Akaike’s Information Criterion) The lower the AIC, the more predictive | |||||||||
Comparing Fit of each Model
Comparing the fit of the three models
Both four-factor models (flat and hierarchical) perform better than the single-factor model.
There is no difference between the hierarchical and the flat models.
Model | df | Chi-Sq | RMSEA | RMSEA CI Lower | RMSEA CI Upper | SRMR | TLI | CFI | AIC |
|---|---|---|---|---|---|---|---|---|---|
1 Factor | 324 | 1,291.895 | 0.095 | 0.089 | 0.10 | 0.075 | 0.754 | 0.773 | 32,381.68 |
4 Factor | 318 | 754.331 | 0.064 | 0.058 | 0.07 | 0.058 | 0.887 | 0.898 | 31,856.11 |
4 Factor Hierarchical | 320 | 757.665 | 0.064 | 0.058 | 0.07 | 0.058 | 0.887 | 0.897 | 31,855.45 |
##
## Scaled Chi-Squared Difference Test (method = "satorra.bentler.2001")
##
## lavaan NOTE:
##     The "Chisq" column contains standard test statistics, not the
##     robust test that should be reported per model. A robust difference
##     test is a function of two standard (not robust) statistics.
##
##                   Df   AIC   BIC   Chisq Chisq diff Df diff Pr(>Chisq)
## fit_model_hier_4 320 31855 32076  757.67
## fit_model_flat   324 32382 32587 1291.90     381.09       4  < 2.2e-16 ***
## ---
## Signif. codes:  0 '***' 0.001 '**' 0.01 '*' 0.05 '.' 0.1 ' ' 1
Reduced CFA
Four Factor Hierarchical
Fit Indices | df | Chi-Sqa | RMSEAb | RMSEA CI Lower | RMSEA CI Upper | SRMRc | TLId | CFIe | AICf |
|---|---|---|---|---|---|---|---|---|---|
166 | 355.423 | 0.059 | 0.05 | 0.067 | 0.051 | 0.928 | 0.937 | 23,566.82 | |
aCloser to 0 indicate better fit | |||||||||
b(Root mean square error) 0.01 = Excellent; 0.05 = Good; 0.08 = Mediocre | |||||||||
c(Standardized root mean square residual) Closer to 0 indicate better fit | |||||||||
d(Tucker Lewis Index) Closer to 1 indicates better fit | |||||||||
e(Comparative fit index) Closer to 1 indicates better fit | |||||||||
f(Akaike’s Information Criterion) The lower the AIC, the more predictive | |||||||||
Single Factor
Fit Indices | df | Chi-Sqa | RMSEAb | RMSEA CI Lower | RMSEA CI Upper | SRMRc | TLId | CFIe | AICf |
|---|---|---|---|---|---|---|---|---|---|
170 | 742.655 | 0.101 | 0.093 | 0.108 | 0.072 | 0.786 | 0.809 | 23,946.06 | |
aCloser to 0 indicate better fit | |||||||||
b(Root mean square error) 0.01 = Excellent; 0.05 = Good; 0.08 = Mediocre | |||||||||
c(Standardized root mean square residual) Closer to 0 indicate better fit | |||||||||
d(Tucker Lewis Index) Closer to 1 indicates better fit | |||||||||
e(Comparative fit index) Closer to 1 indicates better fit | |||||||||
f(Akaike’s Information Criterion) The lower the AIC, the more predictive | |||||||||
Comaparing Fit
Model | df | Chi-Sqa | RMSEAb | RMSEA CI Lower | RMSEA CI Upper | SRMRc | TLId | CFIe | AICf |
|---|---|---|---|---|---|---|---|---|---|
1 Factor | 170 | 742.655 | 0.101 | 0.093 | 0.108 | 0.072 | 0.786 | 0.809 | 23,946.06 |
4 Factor Hierarchical | 166 | 355.423 | 0.059 | 0.050 | 0.067 | 0.051 | 0.928 | 0.937 | 23,566.82 |
aCloser to 0 indicate better fit | |||||||||
b(Root mean square error) 0.01 = Excellent; 0.05 = Good; 0.08 = Mediocre | |||||||||
c(Standardized root mean square residual) Closer to 0 indicate better fit | |||||||||
d(Tucker Lewis Index) Closer to 1 indicates better fit | |||||||||
e(Comparative fit index) Closer to 1 indicates better fit | |||||||||
f(Akaike’s Information Criterion) The lower the AIC, the more predictive | |||||||||