Predicting PEB with Reduced DEEP CTN Scale (Pilot 1 SONA Spr23)
Pilot data collected during the Spring quarter (2023) on SONA students. This was piloting the CFA that will be run on Prolific participants Jan 2024. See DEEP CTN CFA for descriptives from this sample.
Convergent Validity
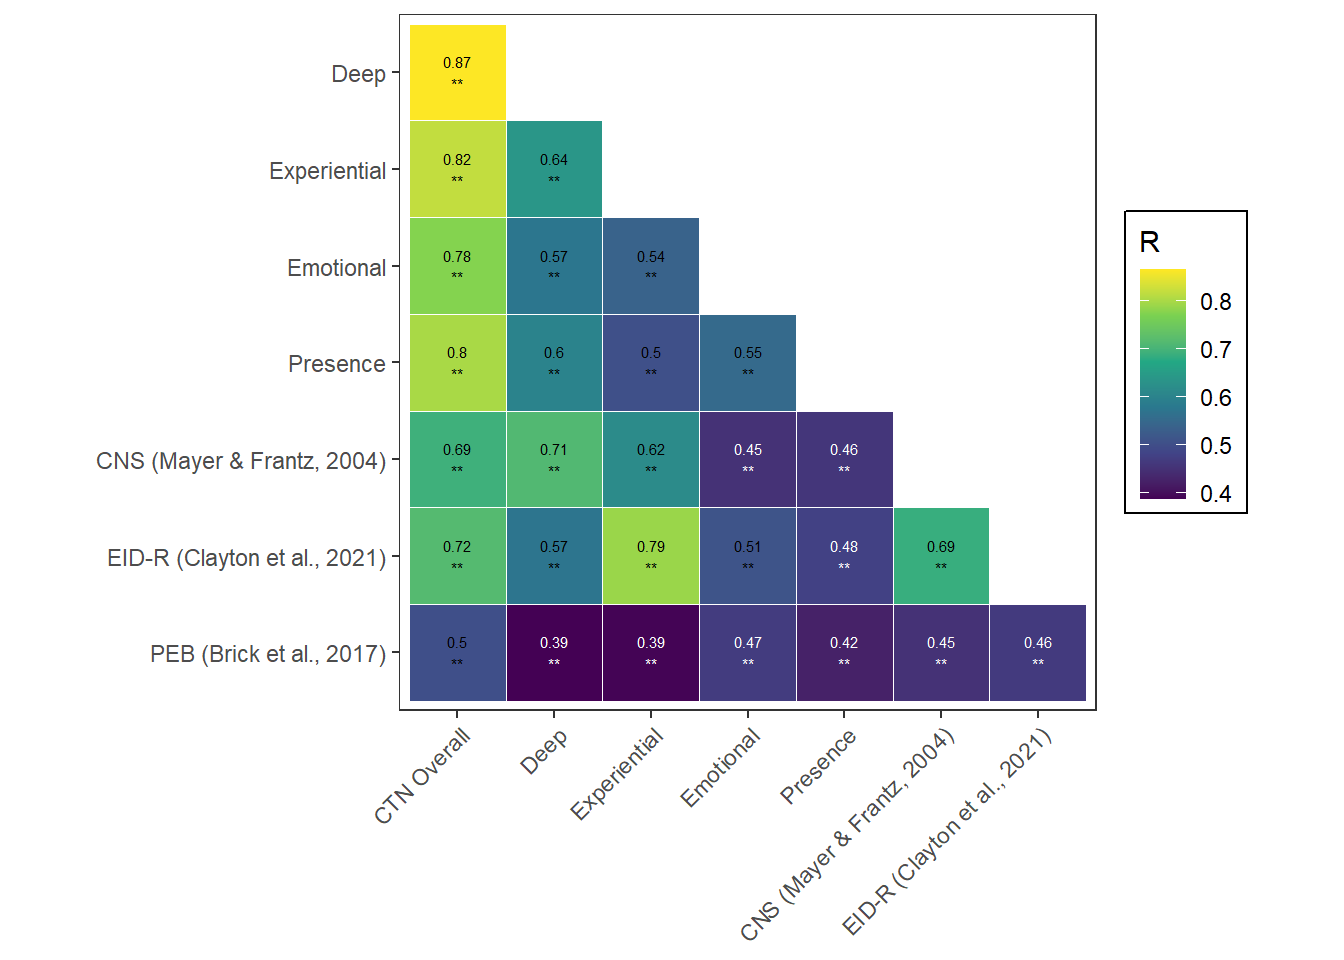
We assessed the convergent validity of the new DEEP CTN scale, that is how closely our new measure is related to other established measures of the same construct. We tested this by looking at the zero order correlation between our new measure and its subscales and two established measures: The Connectedness to Nature Scale (CNS - Mayer & Franz, 2004) and the Environmental Identity Scale revised (EID-R - Clayton et al., 2021)
## TableGrob (2 x 2) "arrange": 4 grobs
##   z     cells    name           grob
## 1 1 (1-1,1-1) arrange gtable[layout]
## 2 2 (1-1,2-2) arrange gtable[layout]
## 3 3 (2-2,1-1) arrange gtable[layout]
## 4 4 (2-2,2-2) arrange gtable[layout]
Predictive Validity
We assessed the predictive validity of the new DEEP CTN scale (i.e., how well our measure can predict participant scores on two theoretically related constructs). The “gold standard” for predictive validity of CTN measures is how well it predicts pro-environmental behavior (PEB) (Clayton, 2003; Clayton et al., 2021; Mayer & Frantz, 2004; Tam, 2013). A zero-order correlation found moderate correlations between PEB and the new subscales of the DEEP CTN scale.
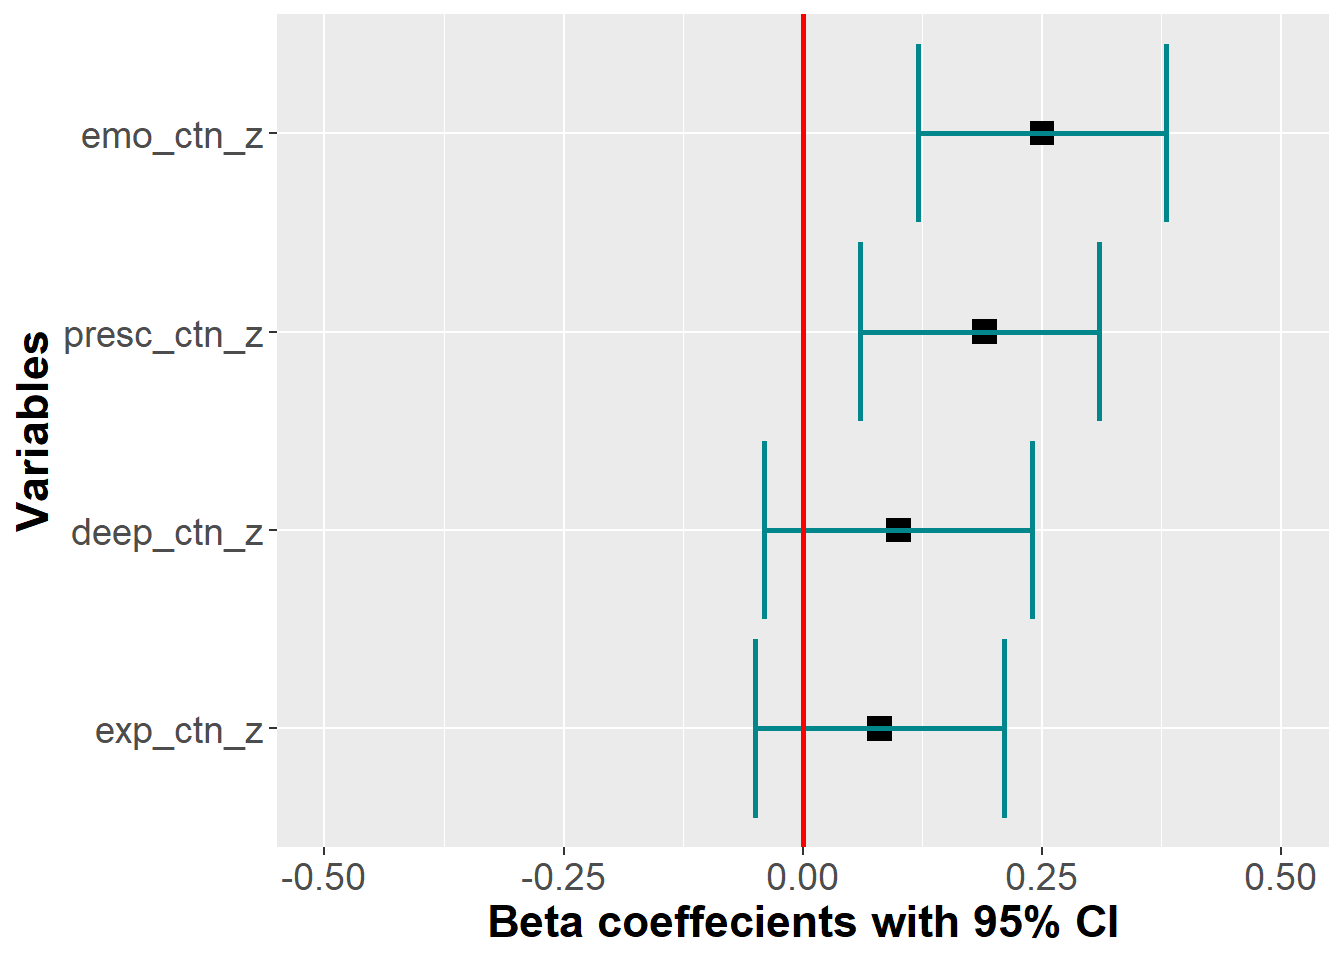
A linear regression with only the subscales of CTN predicting PEB showed that Deep, Emotional, and Presence were adequate to predcict PEB, but not Experiential.
variable | Partial R2 | p | std Beta* | lower_bound | upper_bound |
|---|---|---|---|---|---|
deep_ctn_z | 0.06 | 0.15 | 0.10 | -0.04 | 0.24 |
exp_ctn_z | 0.04 | 0.25 | 0.08 | -0.05 | 0.21 |
emo_ctn_z | 0.09 | 0.00 | 0.25 | 0.12 | 0.38 |
presc_ctn_z | 0.07 | 0.00 | 0.19 | 0.06 | 0.31 |
*< 0.29 = small; | |||||
Total variance explained by the model = 0.26
Incremental Validity
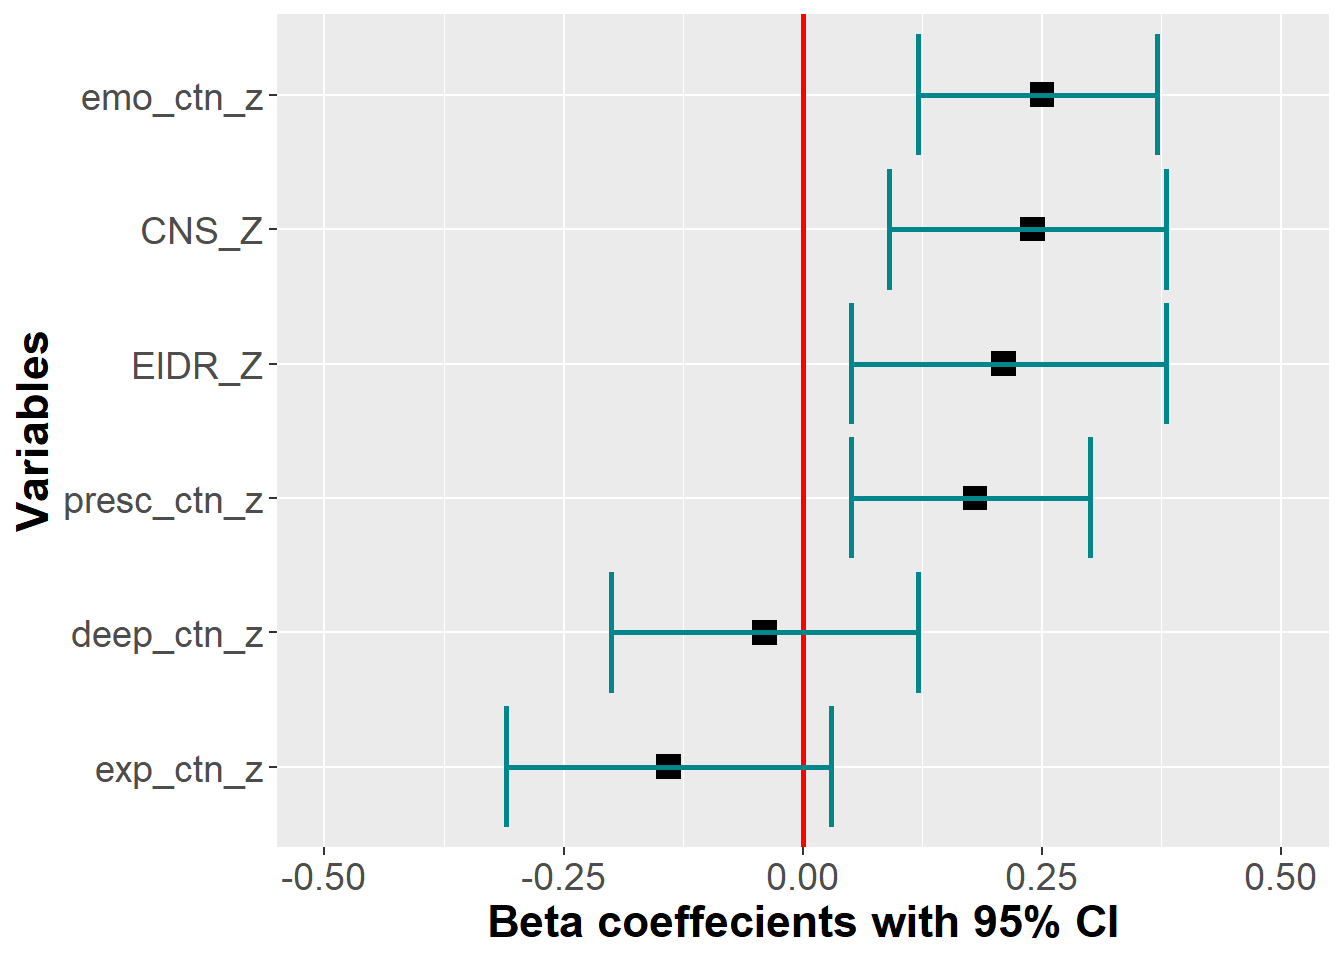
We explored if the DEEP CTN scale and its facets would perform above and beyond existing CTN scales (i.e., CNS and EID-R) when predicting PEB. A linear regression model was run, which included the dimensions of the DEEP CTN scale and the existing CTN measures (CNS and EIDR) were entered simultaneously to predict PEB. Note that because overall CTN was highly intercorrelated with Deep and Emotional, it was left out and only the four dimensions were included.
We found that the Emotional and Presence subscales remained significant predictors when existing measures of CTN were entered into the model. The Deep subscale was no longer a significant predictor. Both our subscales were of equal predictive value compared to the existing measures.
variable | Partial R2 | p | std Beta* | lower_bound | upper_bound |
|---|---|---|---|---|---|
deep_ctn_z | 0.04 | 0.60 | -0.04 | -0.20 | 0.12 |
exp_ctn_z | 0.03 | 0.10 | -0.14 | -0.31 | 0.03 |
emo_ctn_z | 0.07 | 0.00 | 0.25 | 0.12 | 0.37 |
presc_ctn_z | 0.06 | 0.01 | 0.18 | 0.05 | 0.30 |
CNS_Z | 0.06 | 0.00 | 0.24 | 0.09 | 0.38 |
EIDR_Z | 0.06 | 0.01 | 0.21 | 0.05 | 0.38 |
*< 0.29 = small; | |||||
Total variance explained by the model = 0.32
Robustness
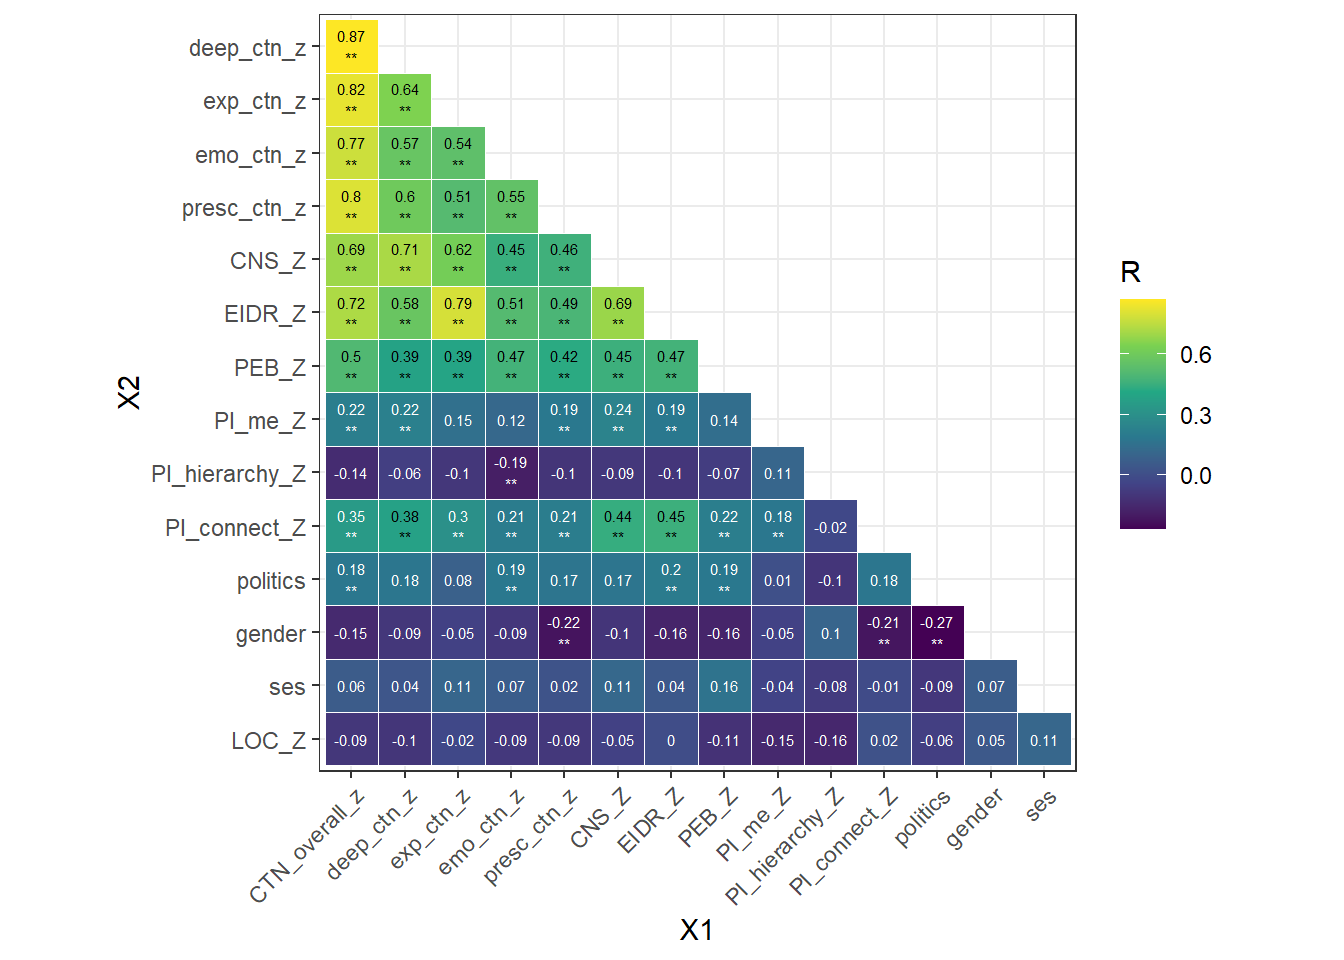
We also tested the robustness of our new DEEP CTN scale, by testing if the DEEP CTN scale and its facets are significant predictors of PEB after controlling for known covariates of these outcomes: political ideology, gender, and socio-economic status (SES). We fist inspected a zero order correlation to identify which covariates should be included. Including any variable that:
strongly correlated with PEB AND
weakly correlated with the Deep CTN Scale may reduce variance in the dependent variable and therefore enhance the likelihood of seeing significant effects of the DEEP CTN scale.
Further, if an additional variable is…
strongly correlated with BOTH PEB AND
the Deep CTN Scale,
its inclusion in the model will address potential mediating effects regarding the relationship between the Deep CTN Scale and a DV of interest. In either case this would suggest it’s important to include as a covariate.
This resulted in including the following covariates:
Politics (r = .19** with PEB & r = .18** to .23** with DEEP CTN dimensions)
Primal Beliefs - The world is interconnect (r = .21** with PEB & r = .22** to .38** with DEEP CTN dimensions)
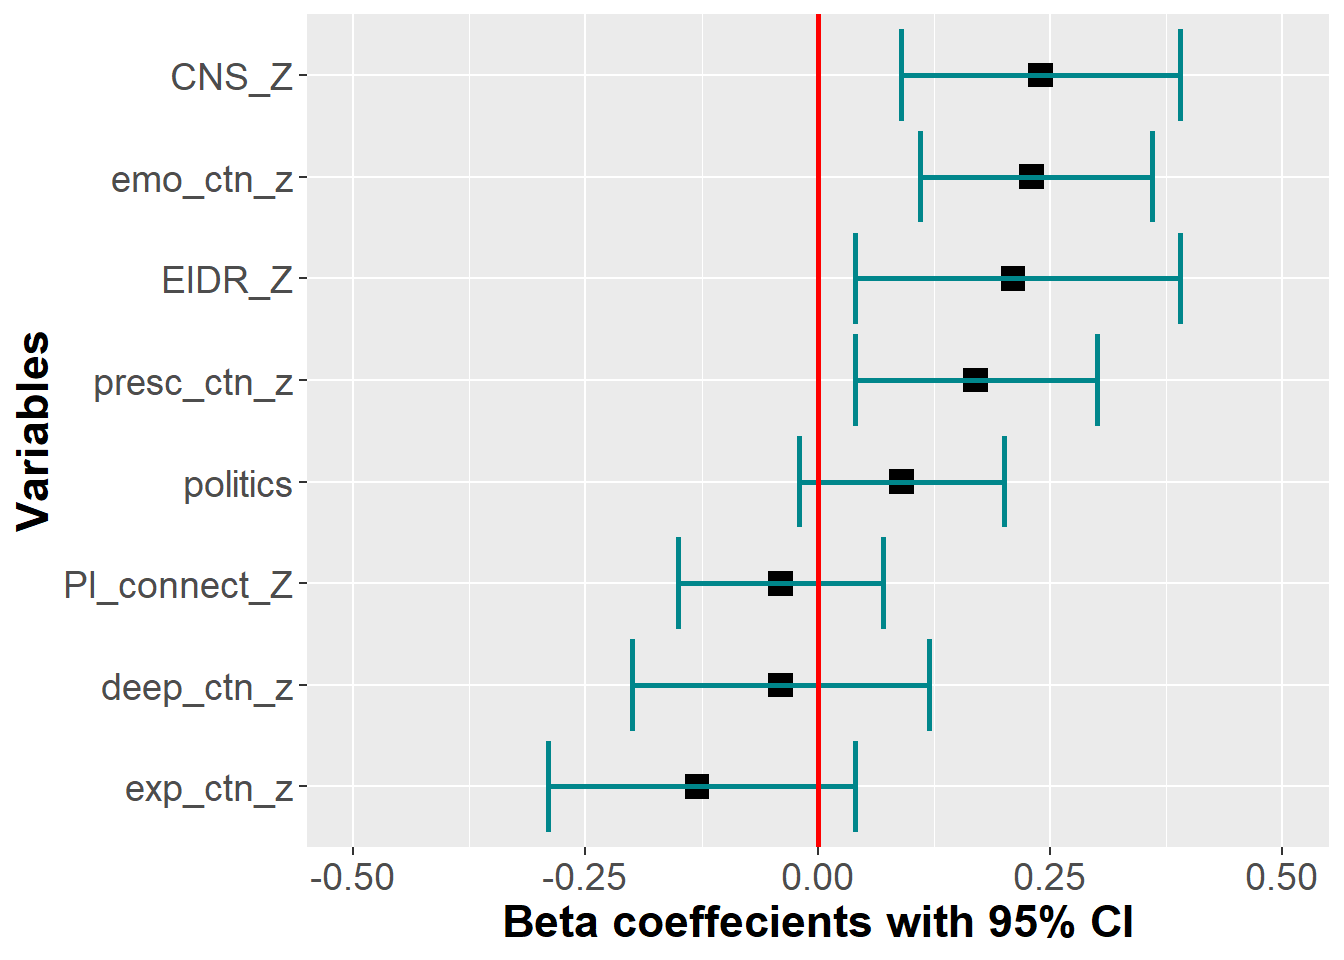
A multiple linear regression model where dimensions of the DEEP CTN scale and existing CTN measures (CNS and EIDR) and the covariates (politics & primal belief interconnectedness) were entered simultaneously to predict PEB is reported in the table below.
By adding the covariates, both Emotional and Prescence subscales remained significant predictors of PEB
variable | Partial R2 | p | std Beta* | lower_bound | upper_bound |
|---|---|---|---|---|---|
deep_ctn_z | 0.03 | 0.60 | -0.04 | -0.20 | 0.12 |
exp_ctn_z | 0.03 | 0.15 | -0.13 | -0.29 | 0.04 |
emo_ctn_z | 0.07 | 0.00 | 0.23 | 0.11 | 0.36 |
presc_ctn_z | 0.05 | 0.01 | 0.17 | 0.04 | 0.30 |
CNS_Z | 0.06 | 0.00 | 0.24 | 0.09 | 0.39 |
EIDR_Z | 0.06 | 0.02 | 0.21 | 0.04 | 0.39 |
PI_connect_Z | 0.01 | 0.50 | -0.04 | -0.15 | 0.07 |
politics | 0.02 | 0.10 | 0.09 | -0.02 | 0.20 |
*< 0.29 = small; | |||||
Total variance explained by the model = 0.33
Comparing Incremental and Robust models
Adding robust variables did not improve the fit of the model above the variables in the incremental validity model
...1 | Res.Df | RSS | Df | Sum of Sq | F | Pr(>F) |
|---|---|---|---|---|---|---|
Incremental | 323 | 227.4189 | ||||
Robust | 321 | 225.1898 | 2 | 2.229055 | 1.588719 | 0.2057883 |