Going Deeper: Validation of the DEEP Connection to Nature Scale
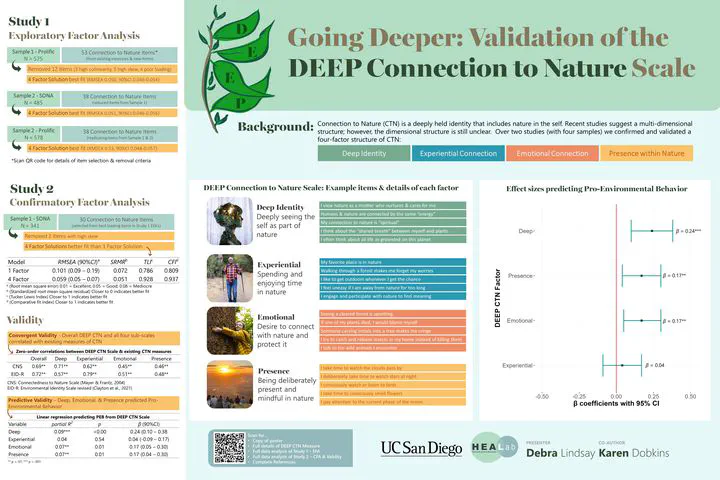
Background
There have been many iterations of a Connection to Nature (CTN) measure (see Ives et al., 2017, Restall & Conrad, 2015, and Tam 2013 for review). Several of these measures have proposed multi-dimensional structure (Davis, Le, and Coy 2011; Dong et al. 2020; Hatty et al. 2020; Kurth et al. 2020; Meis-Harris, Borg, and Jorgensen 2021; Olivos and Aragonés 2011), however there is little consistency across these dimensional structures. We build upon two recently published measures Meis-Harris, Borg, and Jorgensen (2021), which ground their dimensional structure in a thorough cross-disciplinary review of the nature connectedness literature. We extend their findings by addressing concerns that measures of CTN are vulnerable to self-report biases. In particular, concerns have been raised that people may be more likely to endorse CTN items out of social desirability or may simply not be able to express the abstract concept of connection to nature when asked directly (Gould and Schultz 2021). A possible solution to these issues is proposed by the Disposition to Connect with Nature measure which asks about people’s bonding behavior with nature instead of simply asking about preferences to being in nature (Brügger, Kaiser, and Roczen 2011). We adapted items from the Multi-dimensional CTN scale (Meis-Harris, Borg, and Jorgensen 2021) and the Disposition to Connect with Nature scale (Brügger, Kaiser, and Roczen 2011) as well as including several items that we felt addressed the concerns raised about self-report bias.
Across the three exploratory factor analyses, four factors consistently arose as both the best fitting model and aligning with our theoretical framework. We further tested these four factors in a confirmatory factor analysis with a fourth sample and found adequate fit. The dimensions include:
- Deep (deeply seeing the self as part of nature)
- Experiential (spending and enjoying time in nature)
- Emotional (Emotional desire to connect with nature and protect it.)
- Presence (engaging mindfully and consciously with nature)
Selecting Initial Items
Search of existing scales
An extensive search of the literature was conducted to source all existing adult measures of CTN. Based on this search, we identified two measures that showed promise for further adaptation: The AIMES Multidimensional CTN Scale (Meis-Harris, Borg, and Jorgensen 2021) and the Disposition to Connect with Nature scale (Brügger, Kaiser, and Roczen 2011). Our search identified that a multi-dimensional structure should be maintained for the measure, however existing multi-dimensional measures showed conflicting dimensional structure. (Hatty et al. (2020) & Meis-Harris, Borg, and Jorgensen (2021) - the later having a more complex and theoretically driven dimensional structure which is why it was chosen to retain for adaptation). The Disposition to Connect with Nature scale addressed issues of self-report bias though given it was written for a European sample the items were not generalizable to other populations. The items from these two scales resulted in a total of 59 items (AIMES = 19 items; Dispositional CTN = 40 items). Items were reworded for generalizability and clarity. Any reference to “connection to nature” was removed to avoid concerns about participants not fully understanding this concept. Items were also removed if they were redundant. This left a total of 39 items adapted from existing measures (AIMES = 17 items; Dispositional CTN = 28). See Table 1 below for all items considered for inclusion in the DEEP Connection to Nature Scale.
Development of new items
We chose to build upon the strong theoretical basis for the dimensional structure of the AIMES with some changes. Meis-Harris, Borg, and Jorgensen (2021) based the dimension of the AIMES (Affection, Identity, Materialism, Experience, & Spirituality) off Ives et al. (2018) which lists five aspects of human-nature relationships that can lead to behavioral change. We agree with that three of these dimensions are part of the construct of CTN (these are also widely agreed to be part of the construct of CTN in the literature):
- Experiential (time spent in nature)
- Cognitive (beliefs about the self’s relationship with nature)
- Emotional (affective relationship with nature).
However, they included two value-based dimensions which, while strongly correlated to CTN, have been defined as separate constructs (Schwartz 1992, 1999; Schultz 2001; Stern and Dietz 1994):
- Material values towards nature (viewing nature as a resource for human extraction e.g., extrinsic values)
- Philosophical views of nature (viewing humans as interrelated with nature e.g., universal values)
We chose to remove the the material dimension entirely and adapt the philosophical dimension so it more accurately reflected the individual level of CTN. That is, it measured one’s own beliefs about how, as an individual, they are connected to nature. In line with this re-analysis of the construct of CTN we further adapted the existing 39 items and created an additional 14 items in order to capture the following dimensions of CTN:
- Experiential
- Cognitive
- Emotional
- Spiritual (formerly philosophical)
Items were created to capture, behavioral, embodied, and experiential relationships with nature (in line with Brügger et al., 2011’s Disposition to CTN) in order to overcome concerns with self-report bias. This resulted in items that asked about conscious attendance to nature. There was also an effort to create items that updated previous philosophical items to more individual relationships with nature which tapped into a more spiritual relationship. This resulted in a total of 58 items.
Table 1. Items considered for inclusion in the DEEP Connection to Nature Scale
| Original Scale | Original Item | Reworded | Notes |
|---|---|---|---|
| AIMES | I feel uneasy if I am away from nature for too long | ||
| AIMES | I feel right at home when I am in nature | ||
| AIMES | I feel a sense of emotional connection to nature | ||
| AIMES | I think of myself as an ‘environmentalist’ | ||
| AIMES | I think of myself as someone who is very concerned about taking care of nature | ||
| AIMES | Protecting nature is an important part of who I am | ||
| AIMES | My relationship to nature is a big part of how I think about myself | ||
| AIMES | I like to get outdoors whenever I get the chance | ||
| AIMES | Being in nature allows me to do the things I like doing most | ||
| AIMES | My connection to nature is something I would describe as “spiritual” | ||
| AIMES | Human wellbeing depends upon living in harmony with nature | ||
| AIMES | Human beings and nature are connected by the same ‘energy’ or ‘life-force’ | ||
| Disposition to CTN | I mimic animal behaviour; for example, the way a vulture walks | When encountering an animal I mimic their facial expressions or behaviour | |
| Disposition to CTN | I get up early to watch the sunrise | When possible, I take time to watch the sunrise or the sunset without distractions | |
| Disposition to CTN | I cross meadows barefoot | When I am outside on grass, sand, or soil, I often take off my shoes to feel the ground on my feet | |
| Disposition to CTN | I talk to plants | ||
| Disposition to CTN | I help snails cross the street | I am careful to not step on snails | |
| Disposition to CTN | I watch TV shows that have animals as the main characters | I watch TV shows where the focus is on animals or plants | |
| Disposition to CTN | I take time to watch the clouds pass by | ||
| Disposition to CTN | I take time to consciously smell flowers | ||
| Disposition to CTN | I consciously watch or listen to birds | ||
| Disposition to CTN | I spend time in a park | I spend time in local parks | |
| Disposition to CTN | I deliberately take time to watch stars at night | ||
| Disposition to CTN | Even when it is very cold or rainy I go out for a walk | ||
| Disposition to CTN | I hike or run in nearby nature reserves or forests | I hike or run in nearby nature | |
| Disposition to CTN | I talk to animals | I often talk to the wild animals I encounter (e.g., birds, lizards, rabbits, squirrels) | |
| Disposition to CTN | Indoor plants are part of the family | ||
| Disposition to CTN | Carving a tree feels like cutting myself | Thinking of someone carving a tree makes me feel physical pain | |
| Disposition to CTN | If one of my plants dies, I reproach myself | If one of my plants died, I would blame myself | |
| Disposition to CTN | If there is an insect, such as a fly, in my home, I try to catch and release it rather than kill it | ||
| Disposition to CTN | I prefer living in a city | ||
| Disposition to CTN | My favorite place is in nature | ||
| Disposition to CTN | Walking through a forest makes me forget about my daily worries | ||
| Disposition to CTN | The noise of crickets gets on my nerves | ||
| Disposition to CTN | I prefer outdoor to indoor sports | ||
| Disposition to CTN | Listening to the sounds of nature makes me relax | ||
| Disposition to CTN | Pets are part of the family | ||
| Disposition to CTN | a cleared forest makes me miserable | Seeing a cleared forest is upsetting to me | |
| Disposition to CTN | It makes me miserable to see a hedgehog that was hit by a car | It makes me upset to see an animal that was hit by a car | |
| New Item | I would enjoy growing and eating produce from my vegetable garden | ||
| New Item | I feel the need to touch plants when I encounter them | ||
| New Item | I pay attention to the changing seasons and how this affects nature where I live | ||
| New Item | I often think about the fact that all life is grounded on this planet that is relvolving around the sun | ||
| New Item | I am aware of the feelings of nature around me - the sun on my skin, the breeze on my face, or the ground under my feet | ||
| New Item | When I eat, I feel thankful for the animals, plants, and earth for nourishing me | ||
| New Item | I pay attention to the current phase of the moon | ||
| New Item | I like the idea that, when I die, my body will return to the earth, nourishing the soil | ||
| New Item | I regularly engage in a ritual practice that involves nature (e.g., full moon or solstice rituals) | ||
| New Item | I think about the “shared breath” between myself and plants; I breathe in the oxygen released by plants, and plants use the carbon dioxide I exhale. | ||
| New Item | I view nature as a mother who nurtures and cares for me | ||
| New Item | Every part of nature is sacred | ||
| AIMES | Feeling connected to nature helps me deal with everyday stress | Removed due to similarity to another item (Walking through a forest makes me forget about my daily worries). This item also includes the abstract concept “connection to nature” | |
| AIMES | Forests are valuable mostly because they produce wood products, jobs and incomes for people | Removed as this construct is better described as a worldview than as connection to nature | |
| AIMES | Meeting the needs of people requires sacrificing some natural areas | In order to meet the needs of people, some natural areas must be sacrificed | Initially reworded for clarity then removed as this construct is better described as a worldview than as connection to nature |
| AIMES | In order to provide us with the goods and services we need we can’t avoid nature being degraded | Removed as this construct is better described as a worldview than as connection to nature | |
| AIMES | I enjoy spending time in nature | Removed due to simliarity to another item (my favorite place is in nature). Kept the other item as it was less direct | |
| AIMES | Getting away on an overnight trip in nature is something I do as often as I can | Getting away on an overnight trip in nature is something I would like to do as often as I can | Removed due to similarity to another item (I like to get outdoors whenever I get the chance) and there has been debate about the phrasing of this item, many people find it confusing |
| AIMES | Everything in nature is connected (e.g., animals, plants, humans, water, air, land, fire, etc) | Decision to keep reference to nature in this item because it is not being used as a definition | |
| Disposition to CTN | I collect mushrooms or berries | I would enjoy hunting, fishing, or foraging for plants | Initially changed wording to be more generalizable. Decided to remove altogether because of difficulty with nuance around this concept across cultures |
| Disposition to CTN | I mimic the sounds of animals | When I hear an animal making vocal noises I find myself responding to them with similar sounds | Removed because it is not very generalizable |
| Disposition to CTN | I feel the need to be out in nature | Removed due to similarity to another item (I feel uneasy if I am away from nature for too long) | |
| Disposition to CTN | I have a CD or tape with recorded sounds of nature | I regularly listen to recordings of nature sounds (e.g. insects, whales, running water, birdsong etc.) | Removed due to similarity to another item (listening to nature helps me relax) |
| Disposition to CTN | I collect objects from nature such as stones, butterflies, or insects | Removed because of multiple potential interpretations | |
| Disposition to CTN | I would always prefer spending time alone in nature than with my friends. | Removed as the item too extreme (potential for floor effects) | |
| Disposition to CTN | I prefer forest hikes to city strolls | Removed due to similarity to another item (I hike or run in nearby nature). Kept the other item as it measures actual behaviour while this one may be subject to social desirability bias | |
| Disposition to CTN | The croaking of frogs is comforting | Removed due to similarity to another item (Listening to the sounds of nature makes me relax). Item also does not generalize to all populations | |
| Disposition to CTN | I enjoy gardening | Removed. We created a new item that captured a deeper connection with respect to gardening | |
| Disposition to CTN | As a child I spent time in the woods | Removed because it isn’t adding anything new to the measure | |
| Disposition to CTN | I mourn the loss of pets | I have mourned (or could imagine mourning) the loss of a pet | Changed wording to allow people who have not actually gone through this experience to refelct on the concept |
| Disposition to CTN | Watching animals is exciting | Removed because it is unclear |
Study 1
Exploratory Factor Analysis
Sample
Two general population Prolific samples and one student sample were collected from November 2022 until April 2023 (See Table 2 for details of these samples) Three exploratory factor analyses were conducted on these samples.
Table 2. Sample details across three exploratory factor analyses
Variable | Sample 1 | Sample 2 | Sample 3 | |
|---|---|---|---|---|
N | 575 | 578 | 485 | |
Age | 29.61(6.11) | 20.37(2.38) | 40.56(13.5) | |
Gender | Male | 283 | 257 | 113 |
Female | 256 | 294 | 360 | |
Trans Man | 6 | 7 | 0 | |
Trans Woman | 1 | 2 | 1 | |
Non-binary | 24 | 11 | 11 | |
No response | 5 | 6 | 0 | |
Race | White | 360 | 441 | 89 |
Black | 40 | 41 | 9 | |
Asian | 68 | 31 | 187 | |
Latinx* | - | - | 130 | |
Mixed race | 54 | 30 | 46 | |
Other | 38 | 18 | 21 | |
No response | 15 | 16 | 3 | |
*Prolific does not capture this racial identity | ||||
Items Removed
Sample 1
Several items were removed in sample 1 before the EFA was conducted. These items were also excluded from samples 2 and 3.
A test for overdetermination revealed that the model may be overdetermined due to high colinearity between items (det <.00001). Inspection of the correlations revealed five items with highly colinearity (see Figure 1). Three of these items were removed .
Figure 1. Correlations of items > .80
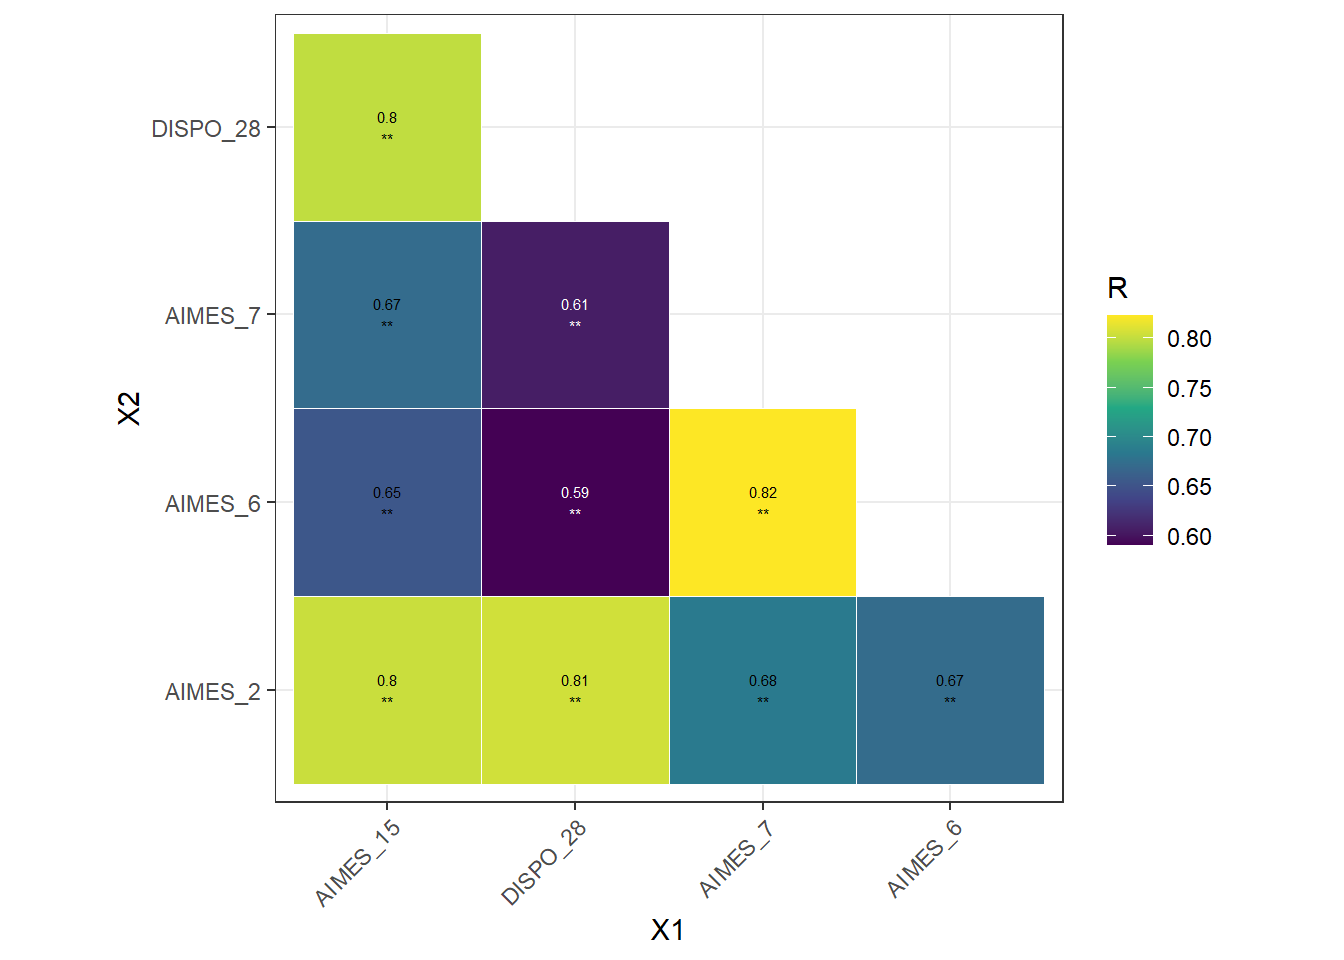
The decision was made to remove AIMES_15, AIMES_7, and AIMES_2. However, removing these items did not improve the risk of overdetermination (det <.00001).
Further assumptions were explored to see if other items should be removed. A Bartlett’s test of sphericity found there was adequate shared variance between items (𝜲2 = 17044.9(1225), p <.001).
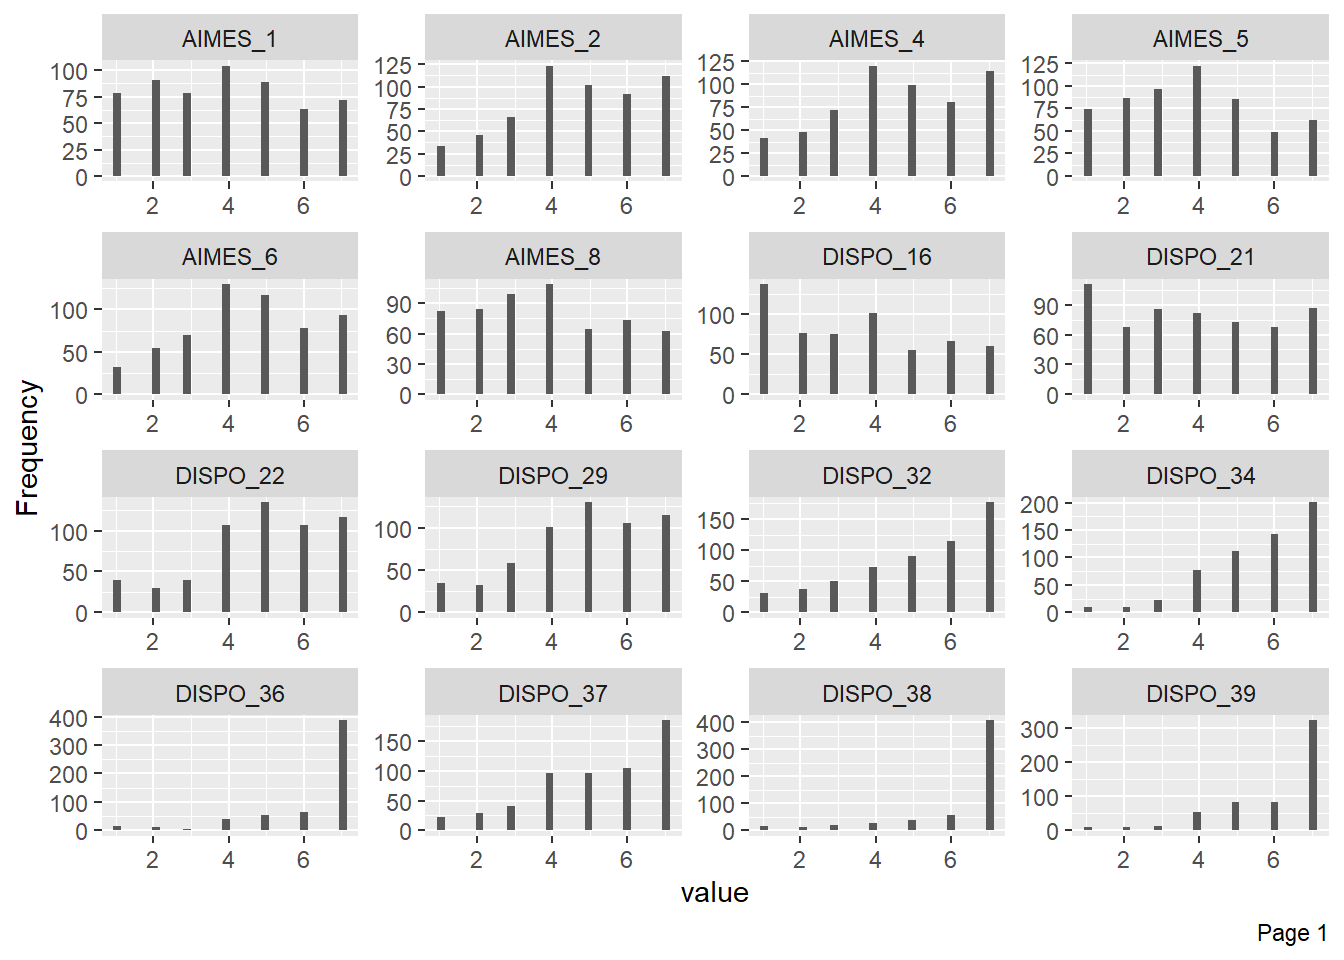
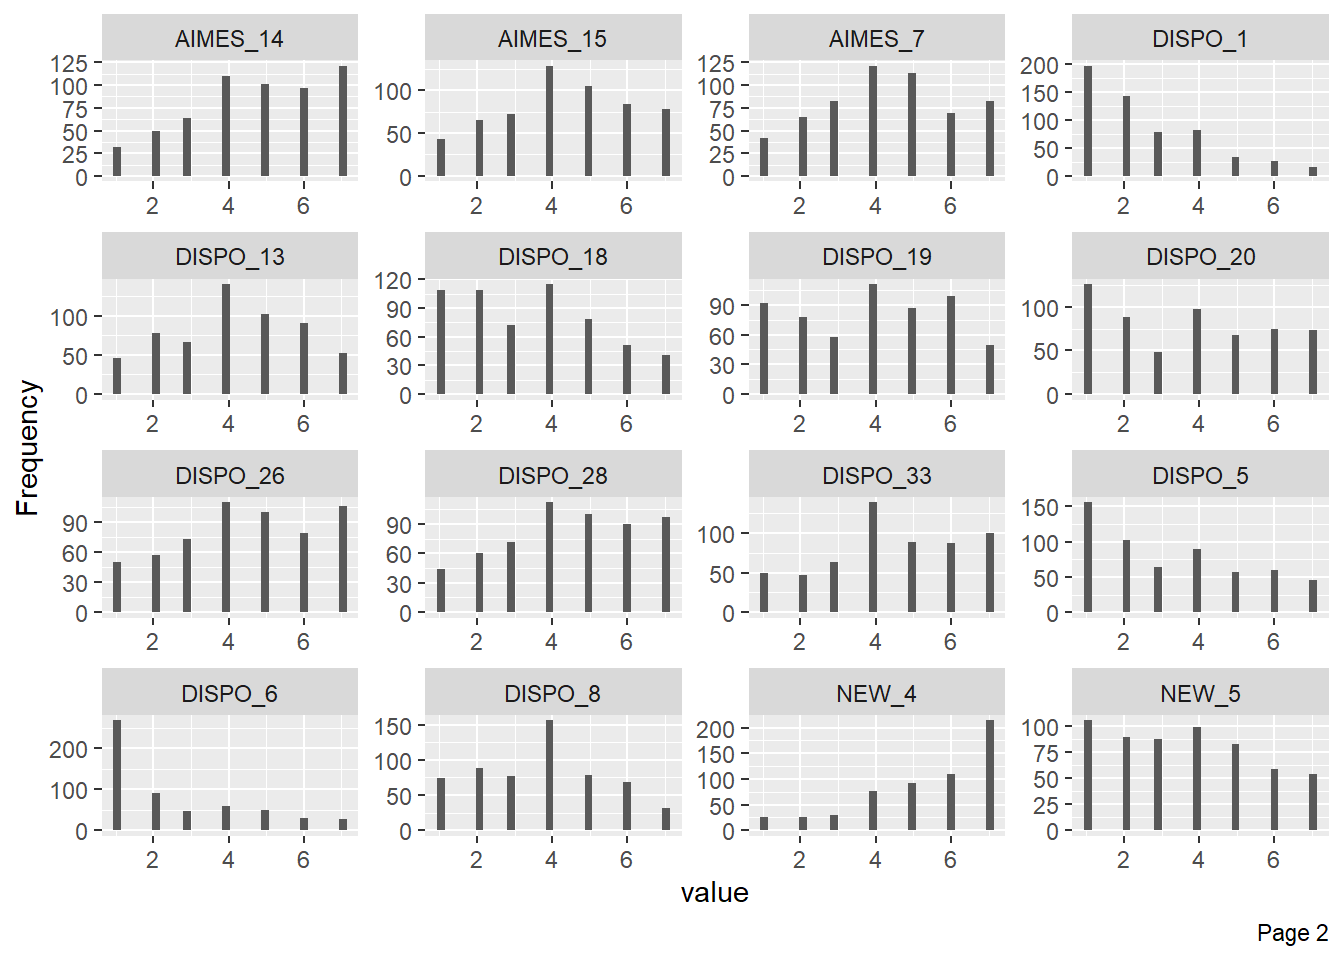
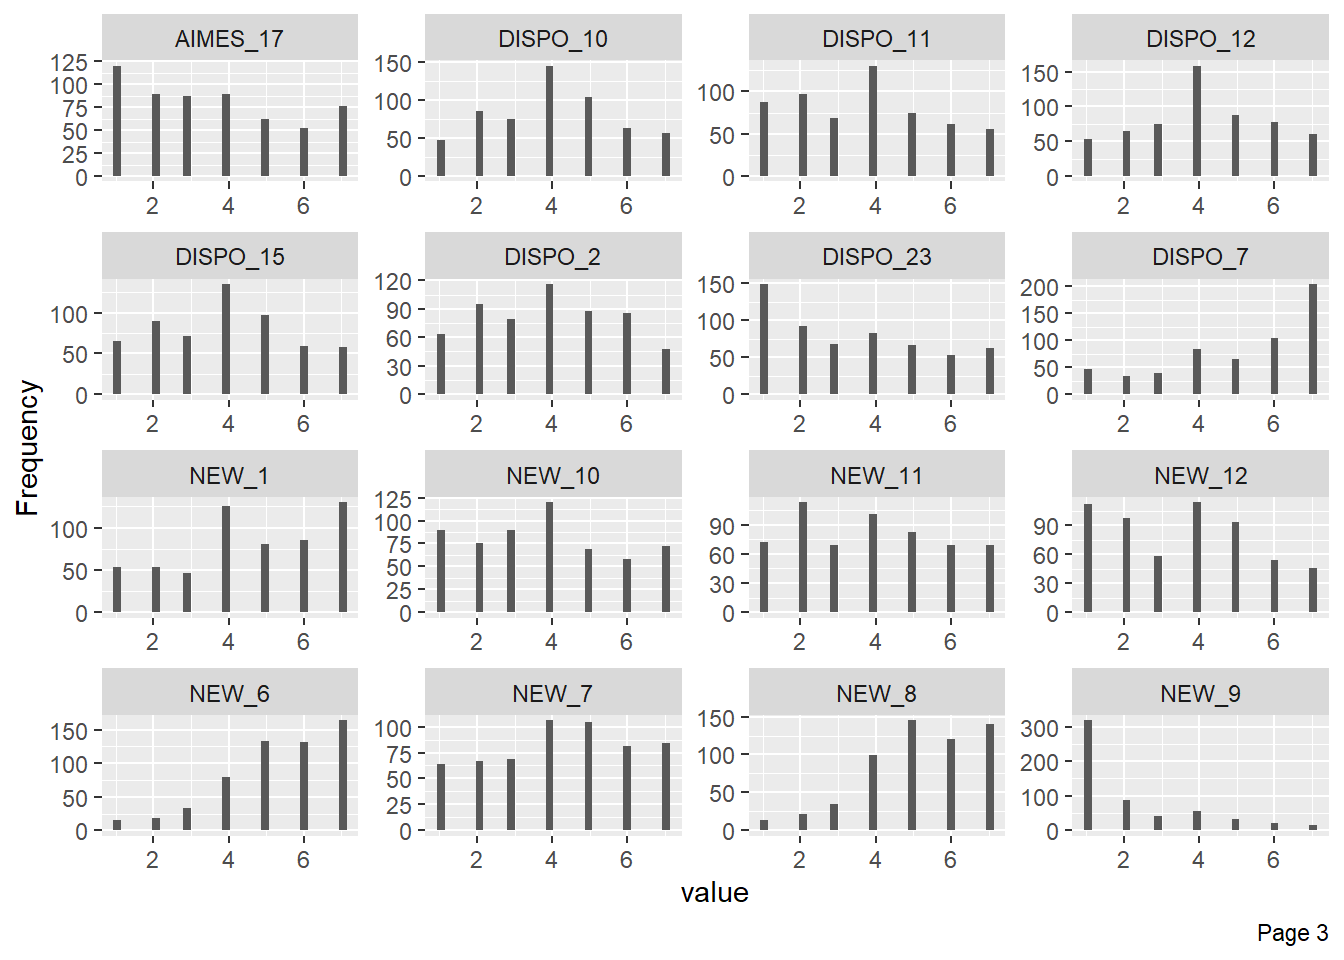
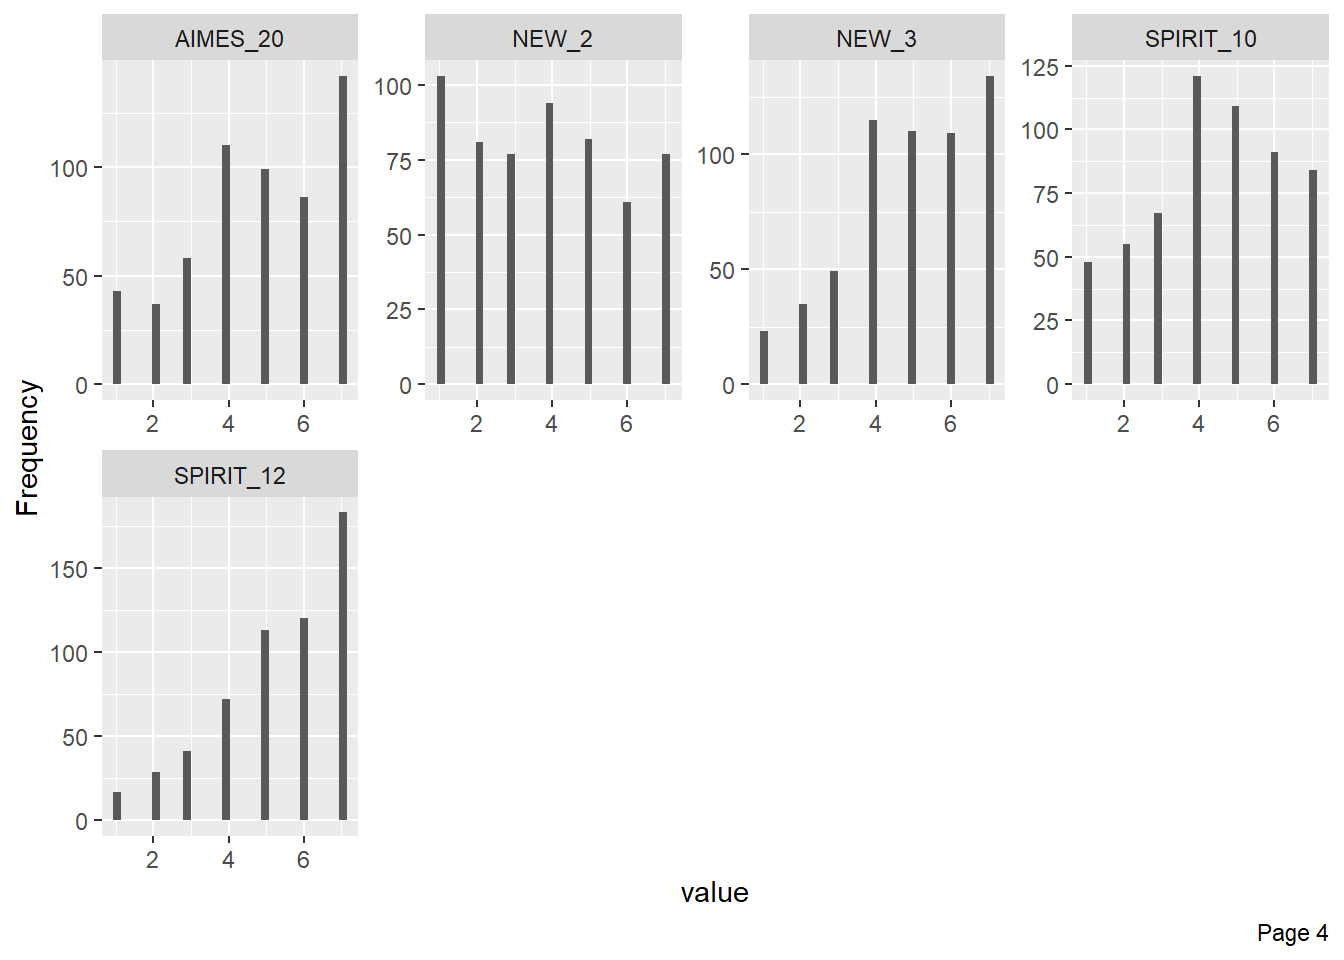
A Kaiser-Meyer-Olkin test of factor adequacy found that, overall, there was adequate variance within items (MSA = 0.97). However, exploration of individual items identified three items which may not have sufficient variance: DISPO_32, DISPO_38, & DISPO_36 (MSA = 0.89, MSA = 0.82, & MSA = 0.84 respectively). Inspection for ceiling and floor effects confirms this, as well as identifying several other items that may have limited variance (See Figure 2). Several items also appeared to have high positive or negative skew (See Figure 3). Five items were removed due to high skewedness (NEW_9, DISPO_38, DISPO_39, DISPO_6, & DISPO_36). A final check of overdetermination revealed there is still the potential for the fit to be overdetermined (det <.00001).
Figure 2. Box plots depicting ceiling and floor effects of items
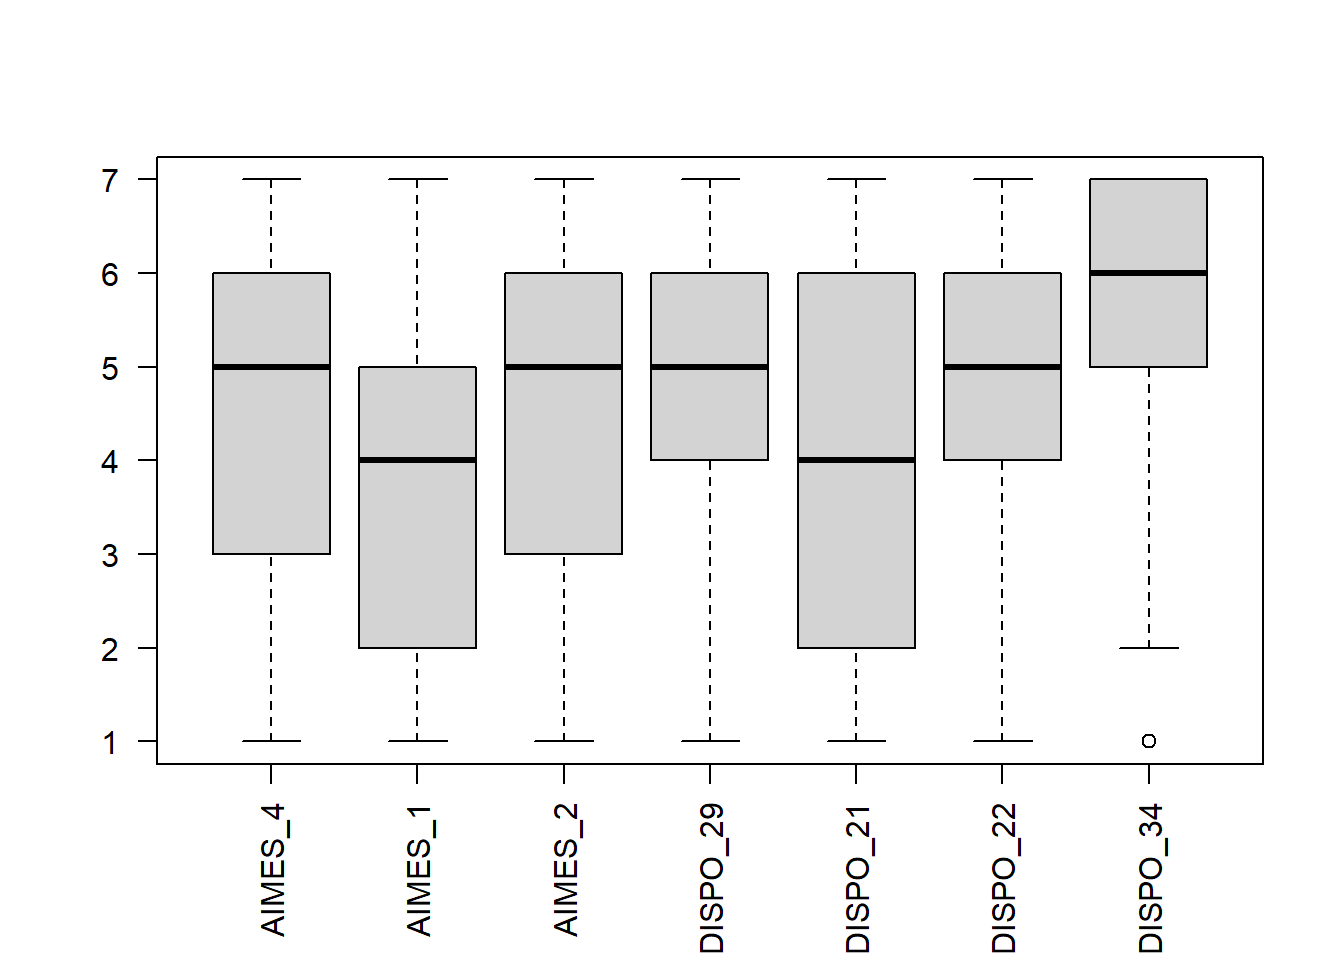
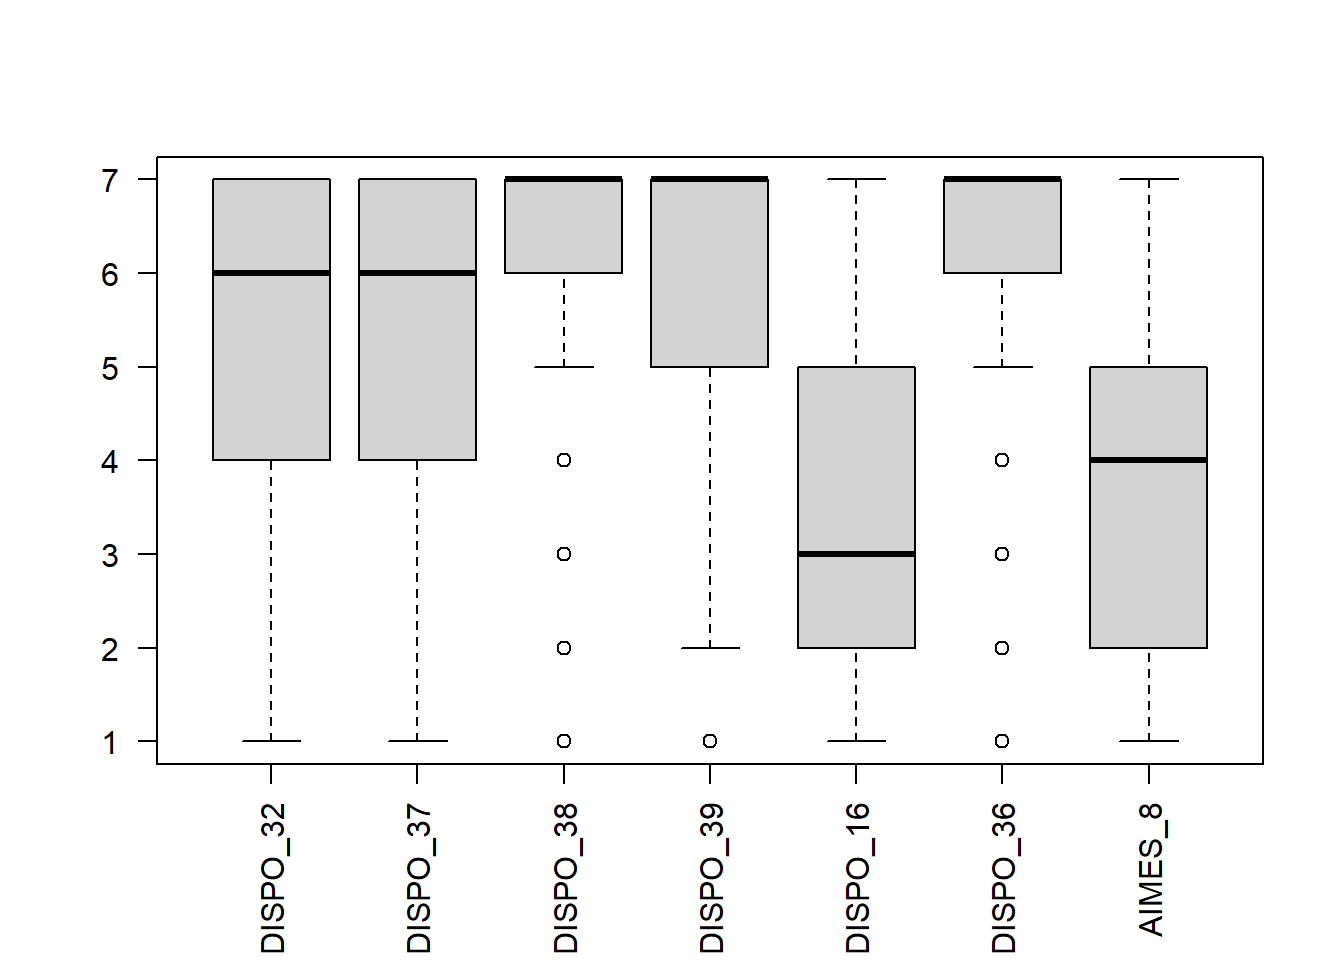
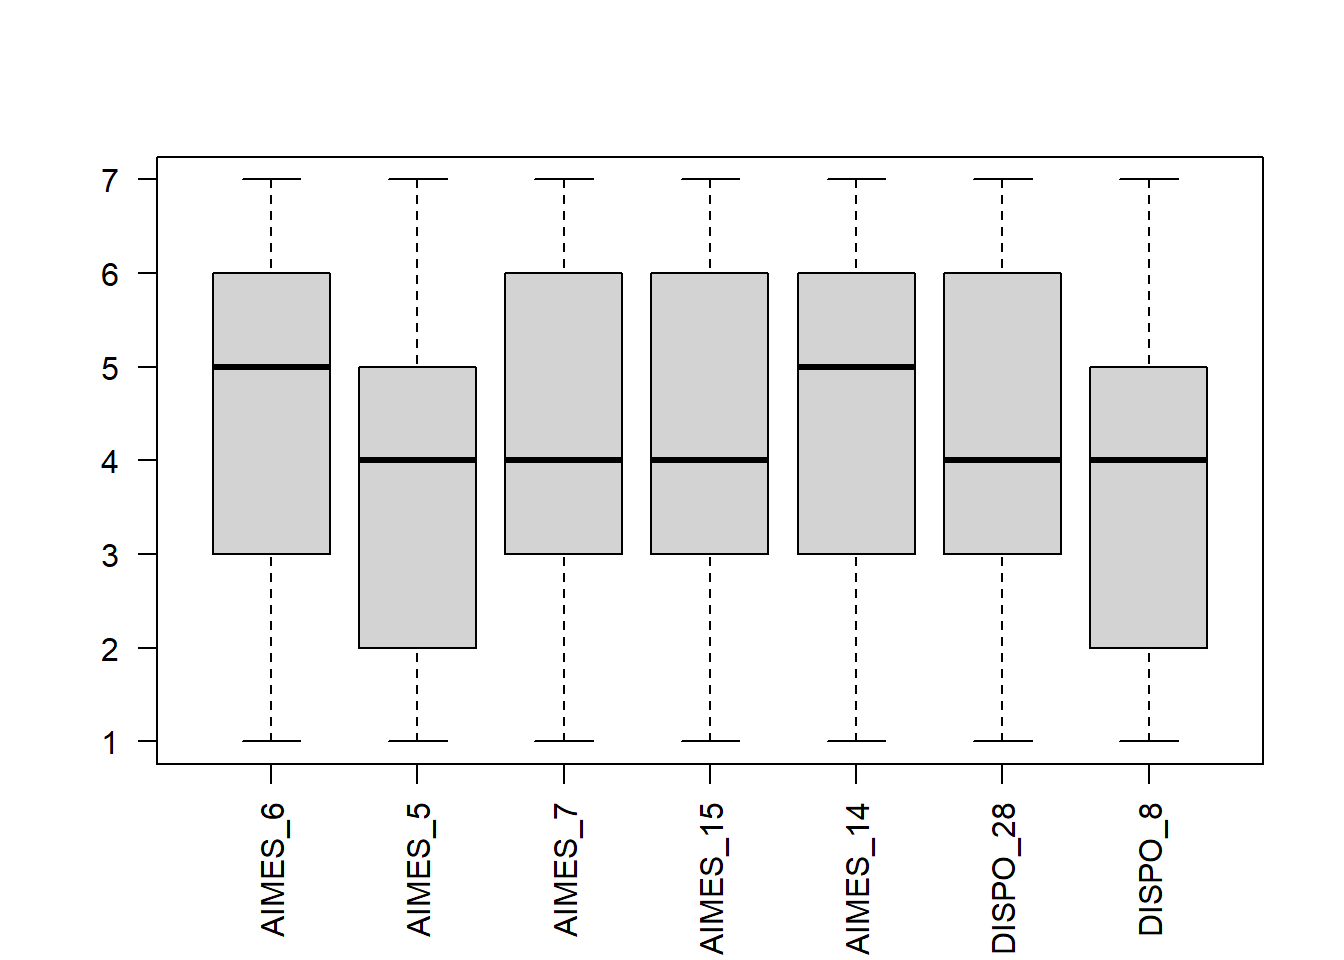
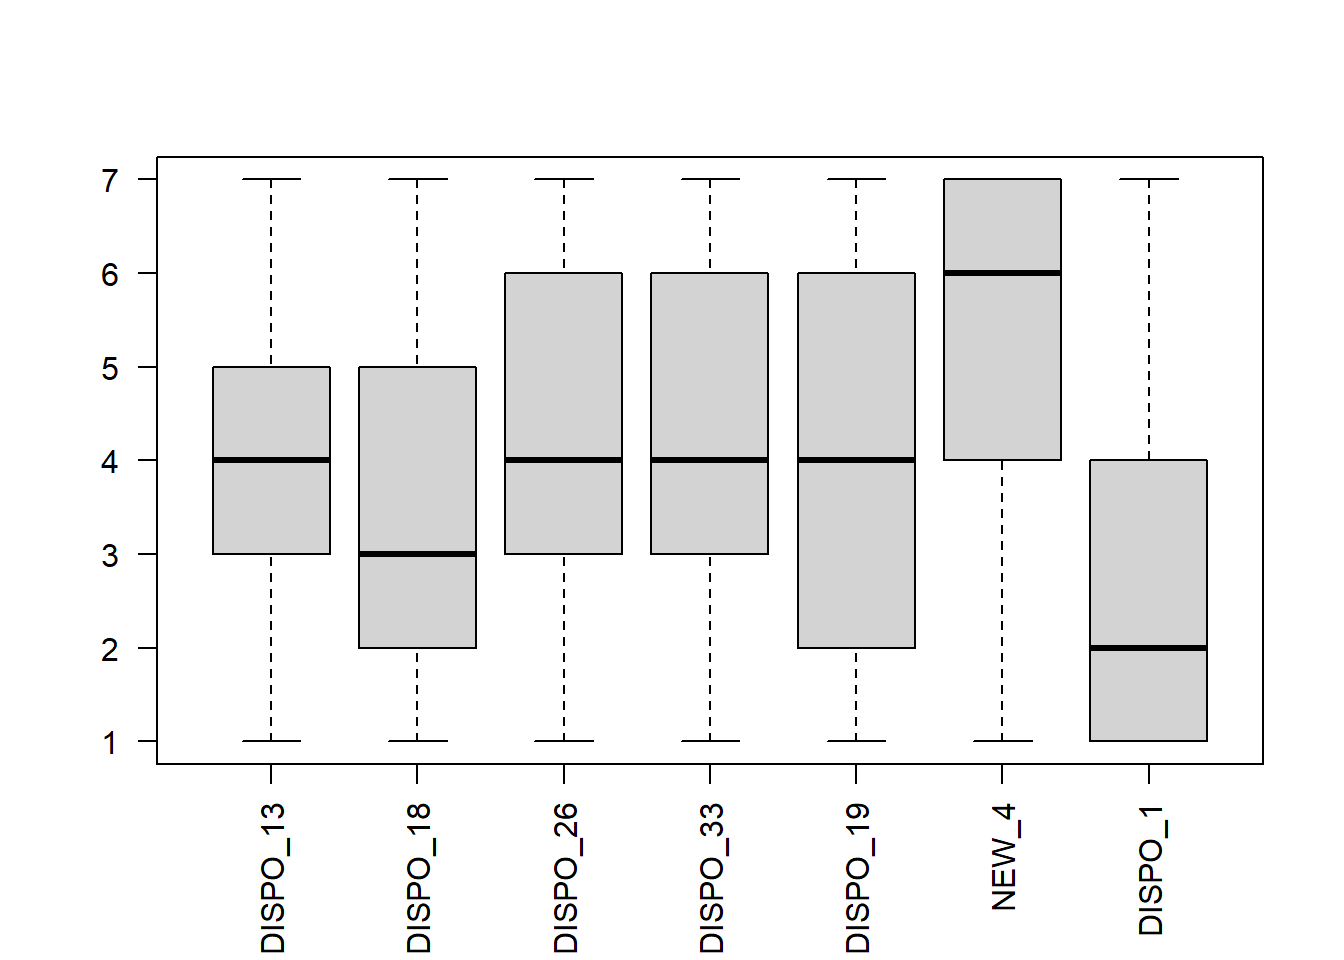
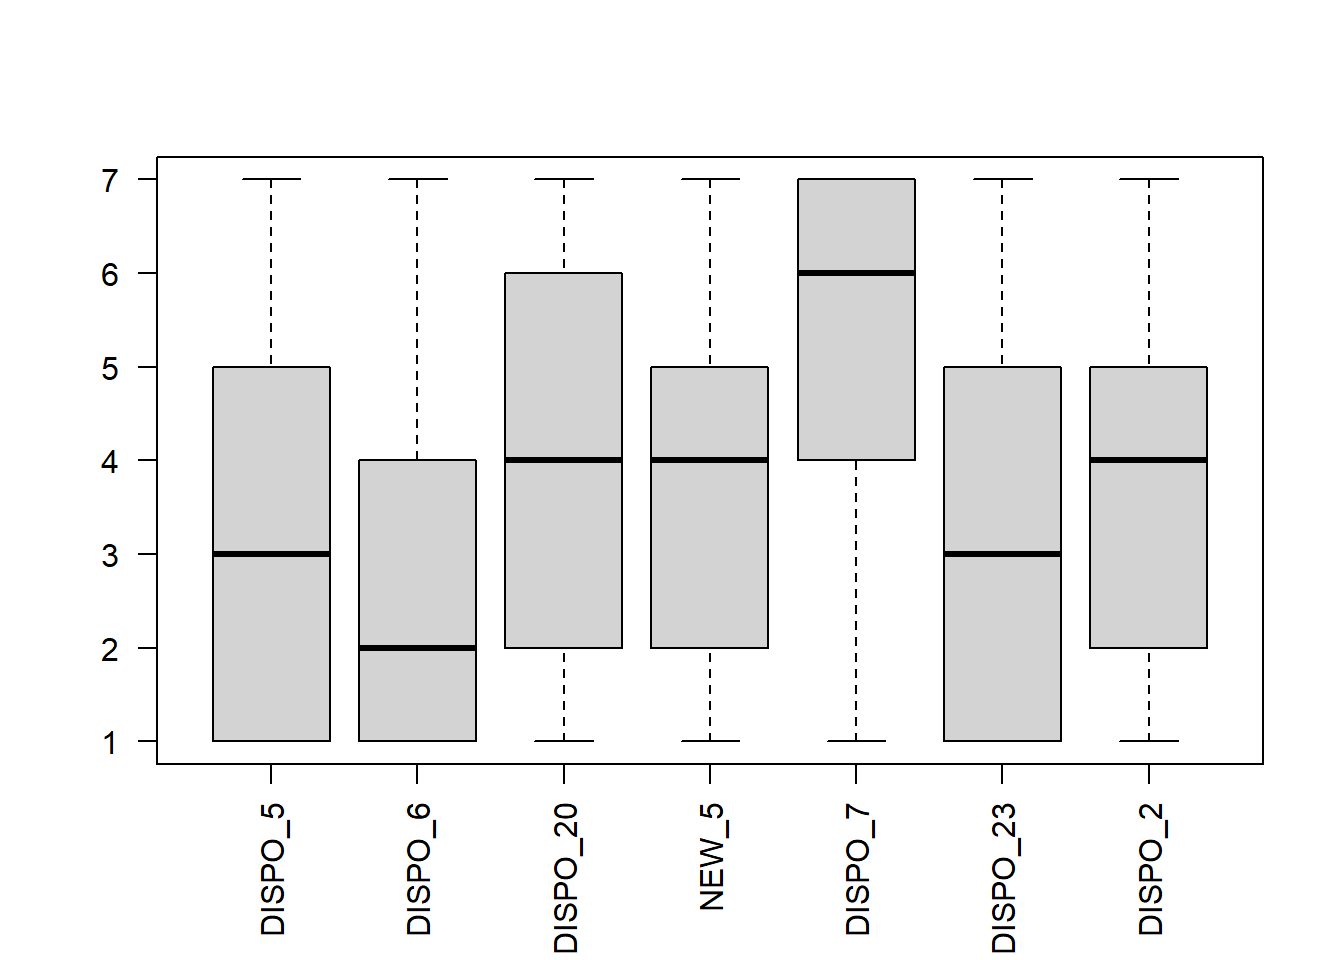
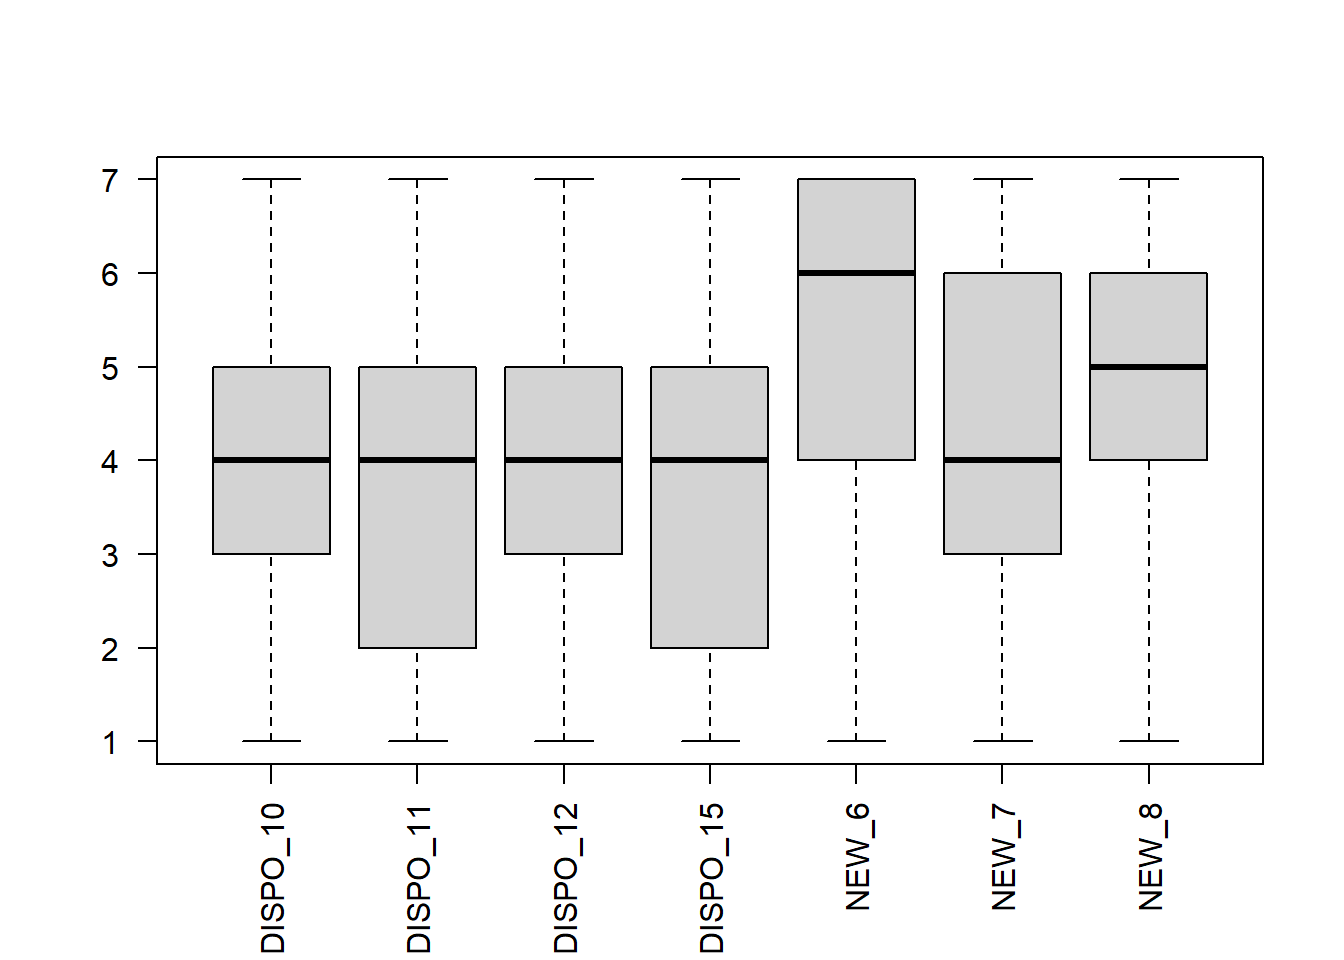
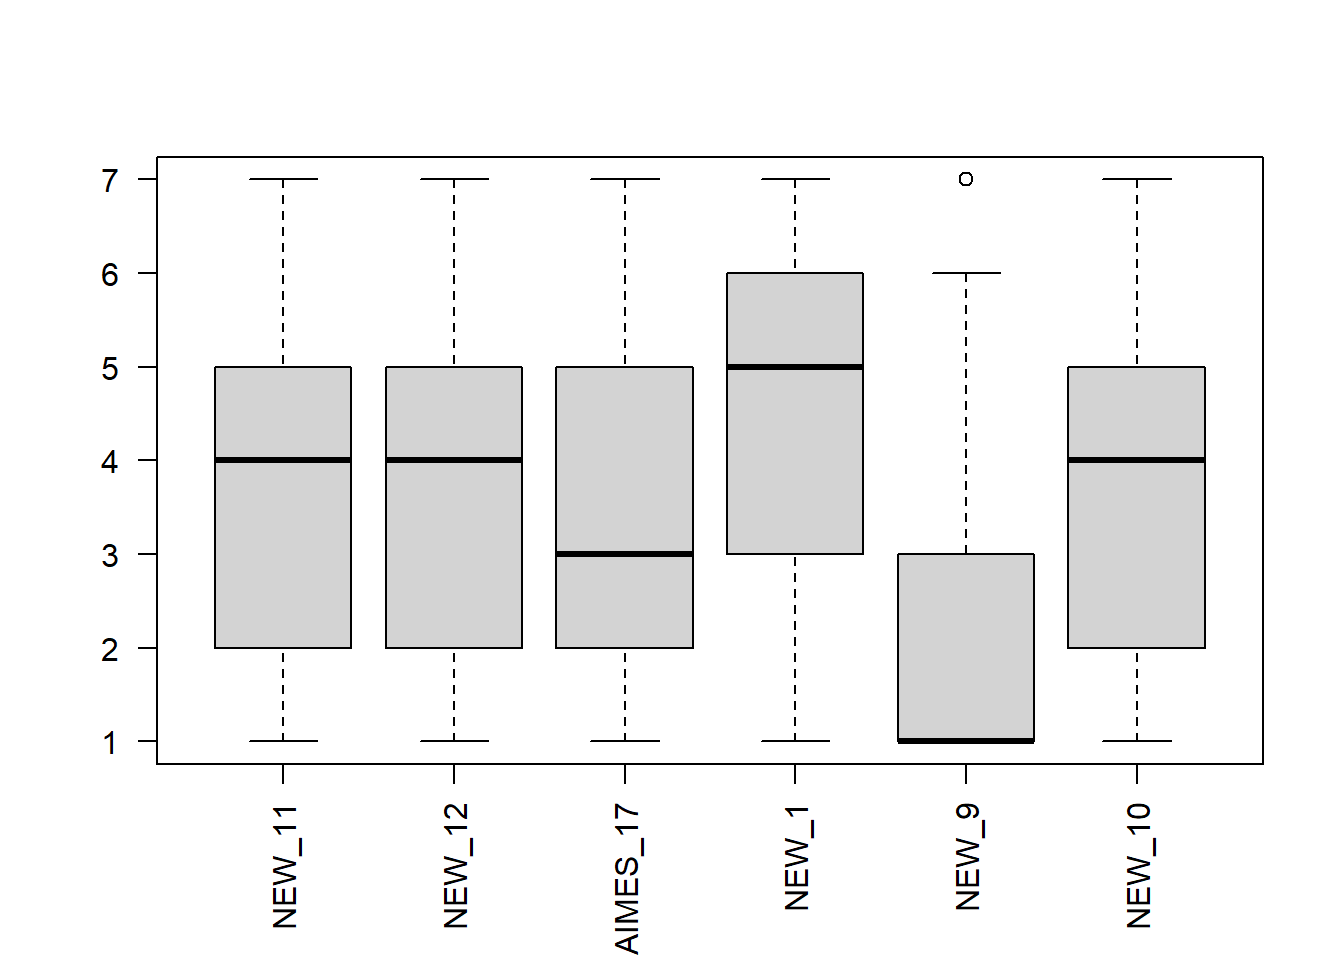
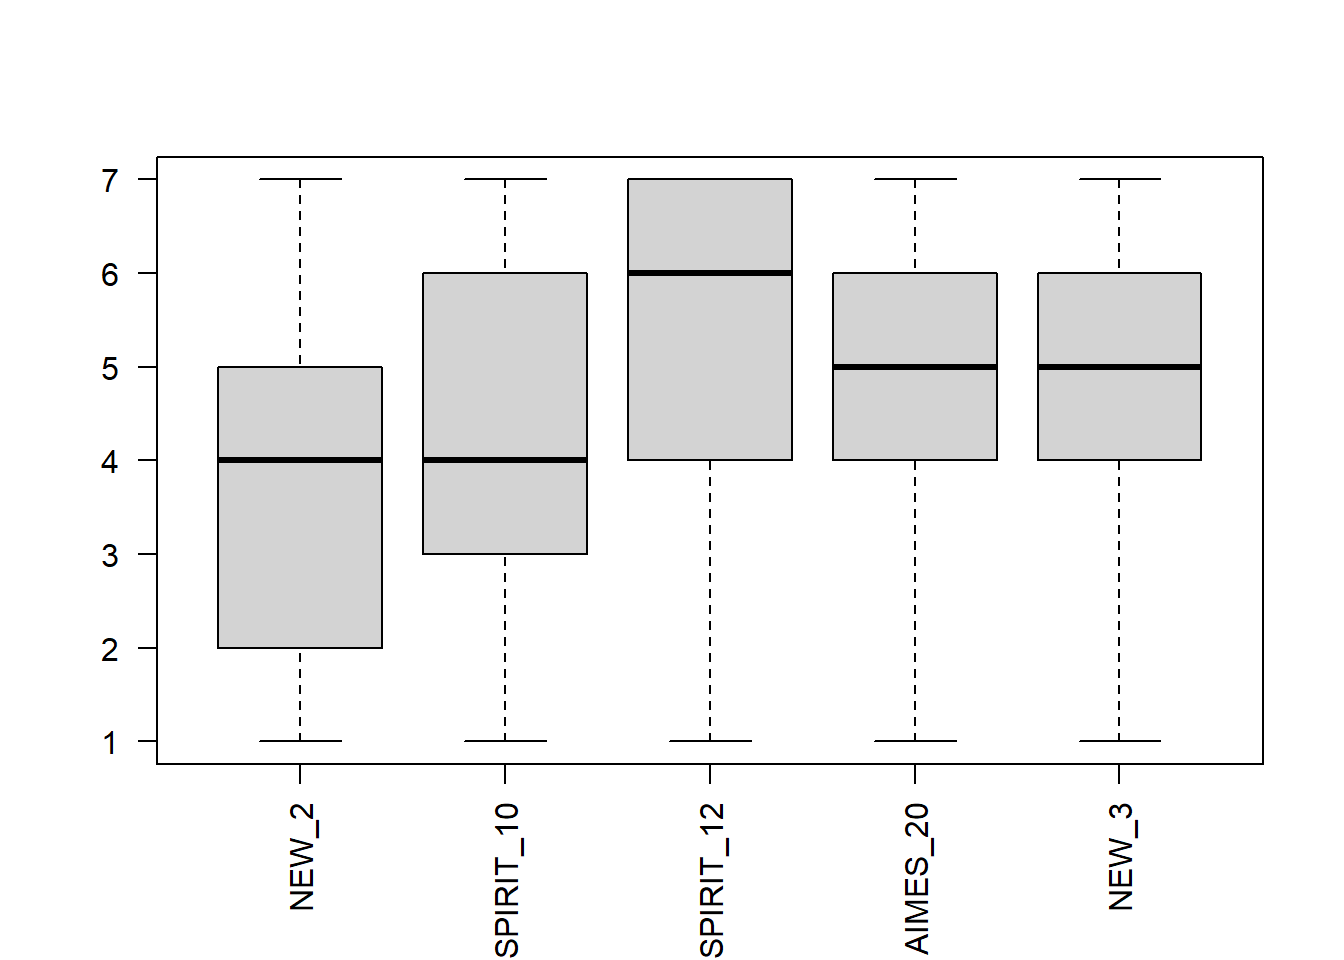
Figure 3. Histograms depicting skewedness of items
Sample 2
A test for overdetermination revealed that the model may be overdetermined due to high colinearity between items (det <.00001). Inspection of the correlations no items with highly colinearity.
Further assumptions were explored to see if other items should be removed. A Bartlett’s test of sphericity found there was adequate shared variance between items (𝜲2 = 8385.44(703), p <.001). A Kaiser-Meyer-Olkin test of factor adequacy found that, overall, there was adequate variance within items (MSA = 0.95). Exploration of individual items showed that no single item was < .80. Inspection of box plots and histograms of distribution showed not items with ceiling/floor effects or high skewedness.
Sample 3
A test for overdetermination revealed that the model may be overdetermined due to high colinearity between items (det <.00001). Inspection of the correlations no items with highly colinearity.
Further assumptions were explored to see if other items should be removed. A Bartlett’s test of sphericity found there was adequate shared variance between items (𝜲2 = 8353.44(73), p <.001). A Kaiser-Meyer-Olkin test of factor adequacy found that, overall, there was adequate variance within items (MSA = 0.95). Exploration of individual items showed that no single item was < .80. Inspection of box plots and histograms of distribution showed not items with ceiling/floor effects or high skewedness.
Number of Factors
Despite the potential for overdetermination, an EFA was conducted using a principal analysis method of extraction. This method has been found to be robust with models with non-normal data (Briggs & MacCullum, 2003). The Psych package in R was used with a promax rotation and principal analysis factoring method.
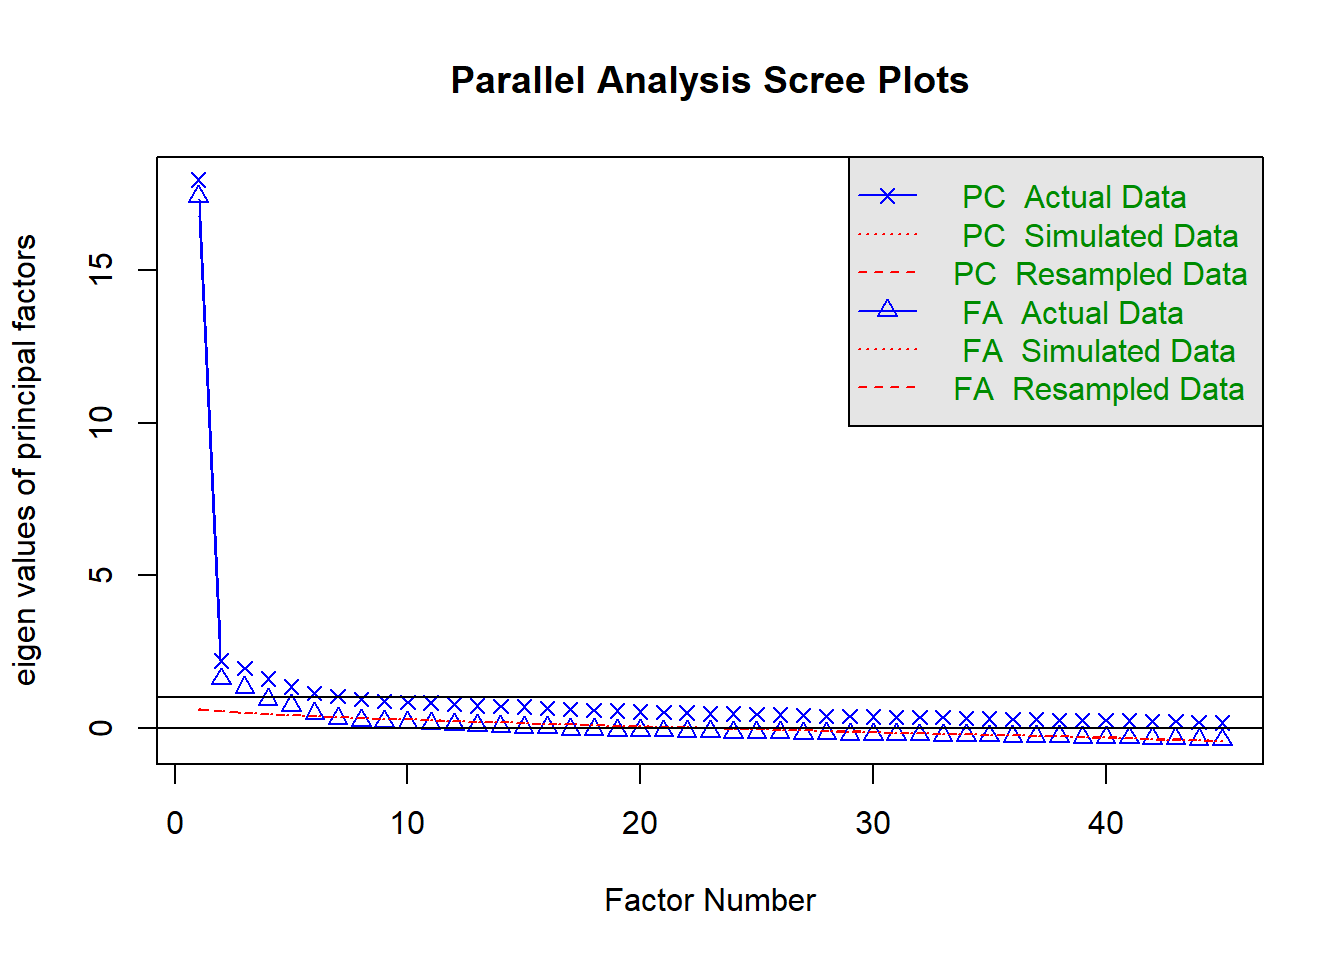
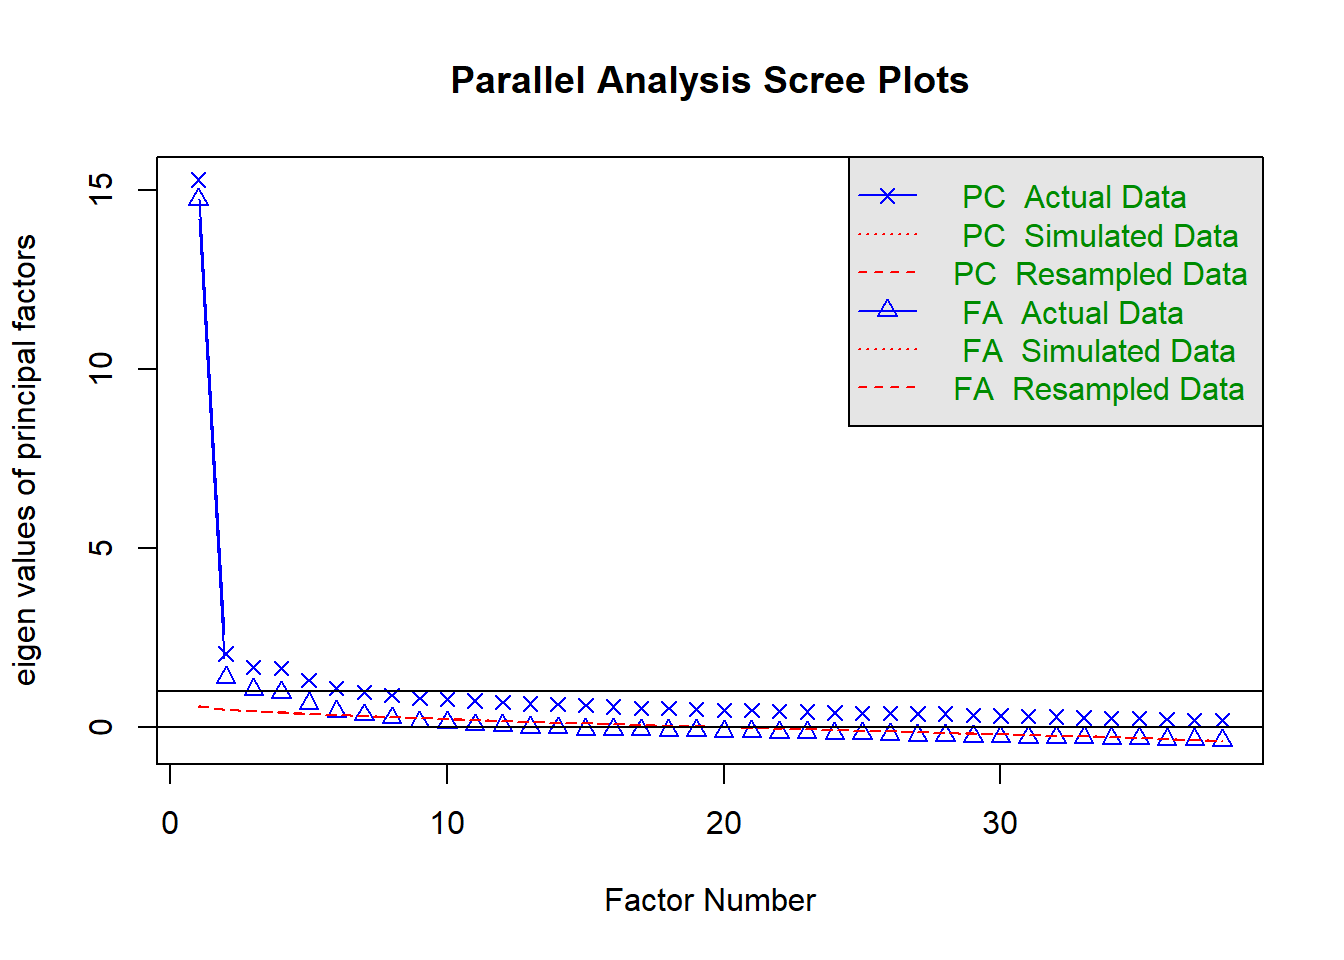
The number of factors to be extracted was estimated using both a scree plot and parallel analysis. The screen plot suggested ~3-4 factors, while parallel analysis suggested 6 factors across all three samples. (See Figure 3)
Figure 3. Scree plots and parallel analysis of the number of factors across three samples
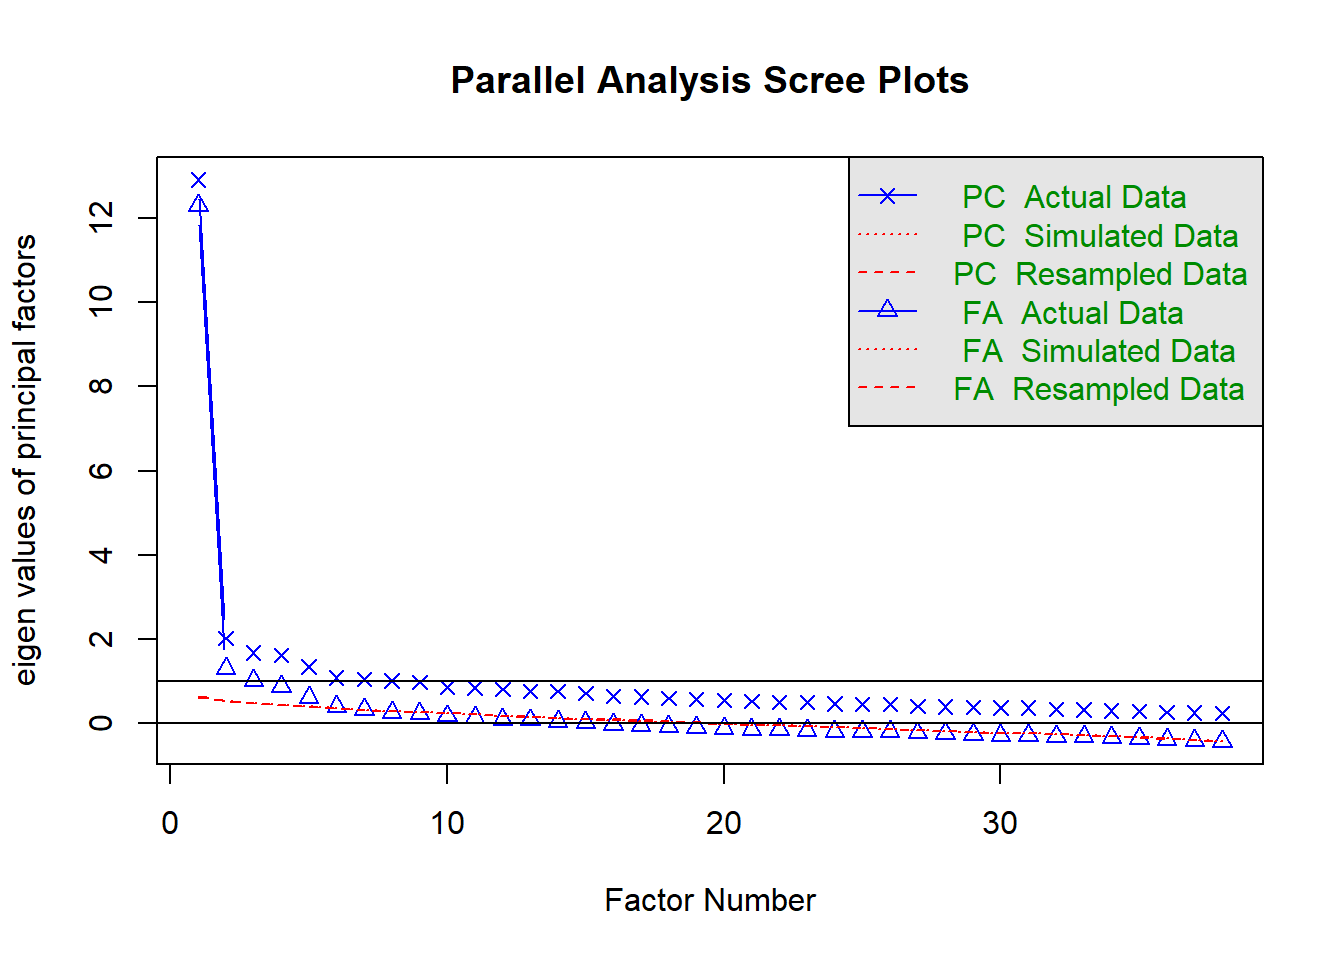
Four models were run across all three samples:
- Six factors
- Five factors
- Four factors
- Simplified four factors (removing dual loading and poor loading items from four factor model)
Item Selection Based on Model Fit
The simplified 4-factor model may be still be overdetermined: determinant < 0.00001 (in all 3 samples), even though we have removed items with high covariance.
Tests of shared variance between items and variance within items both suggest the data is suitable for factor analysis.
-
Sample 1
-
Bartlett’s test of sphericity showed a 𝜲2 = 3171.39(595), p <.001).
-
Kaiser-Meyer-Olkin test of factor adequacy found that, overall, there was adequate variance within items (MSA = 0.97).
-
-
Sample 2
-
Bartlett’s test of sphericity showed a 𝜲2 = 6674.74(406), p <.001).
-
Kaiser-Meyer-Olkin test of factor adequacy found that, overall, there was adequate variance within items (MSA = 0.95).
-
-
Sample 3
-
Bartlett’s test of sphericity showed a 𝜲2 = 6674.74(406), p <.001).
-
Kaiser-Meyer-Olkin test of factor adequacy found that, overall, there was adequate variance within items (MSA = 0.95).
-
We calculated several fit indices and found that the simplified four-factor model was an appropriate fit across all three samples. (See Table 4.) While the full four-factor model, shows better fit according to these indices. We chose to keep the simplified factor due to the full four factor model including items that cross loaded. The factors that emerged were:
-
Deep connection to nature - Deeply seeing ones identity as part of nature
(Note: in the SONA sample, this factor had a lot of “identity” items as well. These “identity” either failed to load on another factor or loaded on the “experience” factor in the Prolific samples.) -
Experiential connection to nature - Spending time in nature and enjoying spending time in nature
-
Emotional connection to nature - Emotional desire to connect with nature and protect it
-
Presence within nature - Engaging mindfully and consciously with nature
Table 4. Fit Indices for 6, 5, 4, and 4-factor simplified models across three samples
Model | Sample | df | χ²a | rmsea (95% CI)b | RMSRc | TLId | BICe |
|---|---|---|---|---|---|---|---|
6-Factor | 1 | 735 | 687.452 | 0.039 (0.036 - 0.042) | 0.025 | 0.940 | -3,294.690 |
2 | 490 | 510.444 | 0.045 (0.042 - 0.049) | 0.025 | 0.931 | -2,048.046 | |
3 | 490 | 584.636 | 0.043 (0.039 - 0.047) | 0.029 | 0.917 | -2,100.851 | |
5-Factor | 1 | 775 | 896.876 | 0.045 (0.042 - 0.048) | 0.028 | 0.921 | -3,259.064 |
2 | 523 | 687.638 | 0.051 (0.048 - 0.055) | 0.029 | 0.911 | -2,005.843 | |
3 | 523 | 711.451 | 0.046 (0.043 - 0.051) | 0.032 | 0.903 | -2,162.265 | |
4-Factor | 1 | 816 | 1,290.292 | 0.052 (0.049 - 0) | 0.034 | 0.894 | -3,107.881 |
2 | 557 | 1,031.578 | 0.058 (0.055 - 0.061) | 0.036 | 0.887 | -1,907.332 | |
3 | 557 | 962.383 | 0.052 (0.048 - 0.055) | 0.038 | 0.881 | -2,167.018 | |
4-Factor Simplified | 1 | 374 | 436.514 | 0.048 (0.044 - 0.052) | 0.028 | 0.934 | -1,503.466 |
2 | 296 | 384.306 | 0.057 (0.052 - 0.061) | 0.029 | 0.922 | -1,038.963 | |
3 | 321 | 501.514 | 0.048 (0.043 - 0.053) | 0.034 | 0.910 | -1,299.213 | |
aChi-Square: Closer to 0 indicate better fit | |||||||
bRoot mean square error: 0.01 = Excellent; 0.05 = Good; 0.08 = Mediocre | |||||||
cStandardized root mean square residual: Closer to 0 indicate better fit | |||||||
dTucker Lewis Index: Closer to 1 indicates better fit | |||||||
eBaysean Information Criterion: The lower the BIC, the more predictive | |||||||
Based on these results we selected 38 items to test in a confirmatory factor analysis. Table 5 displays the loadings of all items across the three samples and details the decisions made to keep or remove those items for the confirmatory factor analysis in the next study. Decisions were made to select items that loaded sufficiently on the four factors across the three samples. Items were retained if:
-
They loaded strongly on the identified factor across all three samples
-
They loaded strongly on the identified factor across two of the three samples
Table 5. Decisions for item selection for the confirmatory factor analysis
Item | Pilot 1 | Pilot 2 | Pilot 3 | |||
|---|---|---|---|---|---|---|
Factor Loadings | Alt Factor Loadings | Factor Loadings | Alt Factor Loadings | Factor Loadings | Alt Factor Loadings | |
Subscale: Deep | ||||||
I view nature as a mother who nurtures and cares for me | 0.84 | 0.94 | 0.89 | |||
Human beings and nature are connected by the same `energy` or `Life-force` | 0.77 | 0.72 | 0.63 | |||
My connection to nature is something I would describe as `spiritual` | 0.75 | 0.73 | 0.89 | |||
I think about the `shared breath` between myself and plants; I breathe in the oxygen released by plants, and plants use the carbon dioxide I exhale | 0.57 | 0.59 | 0.4 | |||
When I eat, I feel thankful for the animals, plants, and earth for nourishing me | 0.54 | 0.56 | 0.5 | |||
I often think about the fact that all life is grounded on this planet that is revolving around the sun | 0.63 | 0.51 | Removed 4 Factor | |||
Every part of nature is sacred | 0.53 | Removed by error (retained in CFA) | Removed by error | |||
I have great respect for being alive on this earth and part of the universe | 0.48 | 0.5 | Removed 4 Factor | |||
I like the idea that, when I die, my body will return to the earth, nourishing the soil | <.40 | 0.51 | 0.5 | |||
Indoor plants are part of the family | <.40 | 0.48 | Removed 4 Factor | |||
My relationship with nature is a big part of how I think about myself | Dual loaded Deep & Experiential | Removed 4 Factor | 0.78 | |||
I think of myself as an `environmentalist` | Removed 4 Factor | 0.68 | ||||
I think of myself as someone who is very concerned about taking care of nature | <.40 | Experience < .40 | 0.67 | |||
I feel a strong emotional connection to nature | Removed 4 Factor | Experience 0.56 | 0.63 | |||
Subscale: Experiential | ||||||
My favorite place is in nature | 0.75 | 0.81 | 0.69 | |||
Walking through a forest makes me forget about my daily worries | 0.71 | 0.71 | 0.6 | |||
I prefer outdoor to indoor sports | 0.6 | 0.65 | 0.66 | |||
Listening to the sounds of nature makes me relax | 0.6 | 0.6 | 0.52 | |||
I hike or run in nearby nature | Removed 4 Factor | 0.5 | 0.49 | |||
I like to get outdoors whenever I get the chance | 0.82 | Removed by error (retained in CFA) | Error did not test | |||
I feel uneasy if I am away from nature for too long | 0.62 | 0.58 | Deep 0.48 | |||
I engage and participate with nature to find meaning and richness in life | 0.55 | 0.56 | Deep 0.58 | |||
I am aware of the feelings of nature around me - the sun on my skin, the breeze on my face, or the ground under my feet | Removed 4 Factor | 0.42 | 0.41 | |||
I feel a strong emotional connection to nature | Removed 4 Factor | 0.56 | Deep 0.63 | |||
Subscale: Emotional | ||||||
Seeing a cleared forest is upsetting to me | 0.62 | 0.58 | 0.49 | |||
If one of my plants died, I would blame myself | 0.56 | 0.45 | 0.65 | |||
I am careful to not step on snails | 0.45 | 0.65 | 0.62 | |||
Thinking of someone carving their initials into a tree makes me cringe | 0.58 | 0.65 | Removed 4 Factor | |||
If there is an insect, such as a fly, in my home, I try to catch and release it rather than kill it | Removed 4 Factor | 0.56 | Removed 4 Factor | |||
I talk to the wild animals I encounter (e.g., birds, lizards, rabbits, squirrels) | Removed 4 Factor | Removed 4 Factor | 0.5 | |||
Subscale: Presence | ||||||
I take time to watch the clouds pass by | 0.87 | 0.72 | 0.73 | |||
I deliberately take time to watch stars at night | 0.84 | 0.86 | 0.86 | |||
When possible, I take time to watch the sunrise or the sunset without distractions | 0.71 | 0.7 | 0.72 | |||
I consciously watch or listen to birds | 0.67 | 0.57 | 0.45 | |||
I take time to consciously smell flowers | 0.63 | 0.53 | 0.53 | |||
I pay attention to the current phase of the moon | 0.57 | 0.65 | 0.45 | |||
I watch TV shows where the focus is on animals or plants | 0.57 | Removed 4 Factor | ||||
Even when it is very cold and rainy, I go out for a walk | 0.49 | Removed < .40 Presence & not fitting | ||||
Factor loadings in bold indicate strong loading on the identified factor; Highlighted loadings indicate strong loadings on the identified factor across all three samples | ||||||
Loadings in the Alt Factor Loadings columns indicate that the item loaded on a different factor | ||||||
Greyed out items removed from confirmatory factor analysis | ||||||
Notes indicate when an item was removed and why | ||||||
Study 2
Sample
394 undergraduate students participated for course credit in May 2023. Thirty-one participants did not complete the study and twenty-two people failed to pass attention checks so their data was not analysed. The final analysis consisted of 341 participants with ages ranging from 18 - 42 (M = 20.88, SD = 2.7). The same was primarily made up of females (68.3%) and people of Asian ethnicity (42.1%). See the table below for full descriptive statistics. Political Ideology was scored on a 7-point Likert scale with 1 = Most Conservative and 7 = Most Liberal. The mean political ideology was 5.04(1.17), showing that this sample skewed more liberal. This is to be expected with our student sample.
Convergent Validity Measures
Two pre-existing CTN scales were used to identify convergent validity. The Connectedenss to Nature Scale (CNS), (Mayer and Frantz 2004) and the Environmental Identity Scale revised (EID-R), (Clayton et al. 2021). The CNS is a 14-item scale designed to measure the cognitive beliefs about how interneconnected one’s self is to nature. It is measured on a Likert scale ranging from 1(strongly disagree) to 5(strongly agree). The EID-R is a 14-item scale designed to measure how interneconnected one’s self is to nature. It is measured on a Likert scale ranging from 1(not at all true of me) to 7(completely true of me).
Predictive Validity Measures
Pro-environmental behavior
Participants completed the Recurring Pro-environmental Behavior scale (Brick, Sherman, and Kim 2017) which asks people to report how often they engage in various pro-environmental behaviors. This scale includes 20 items measured on a Likert scale ranging from 1(never) to 5(always).
Primal Beliefs
Three subscales of the primals beliefs inventory (Clifton et al. 2019) were used to identify worldviews held by participants. The About Me subscale consists of five questions asking how egocentric ones beliefs are (e.g., Whatever is happening around me often feels related to me or something I’ve done). The Hierarchical subscale consists of five questions exploring beliefs about the hierarchical nature of the world (e.g., Things are rarely equal. Most plants and animals, even people, are better or worse than one another.). The Interconnected subscale consists of four items asking how connected or atomistic one believes the world to be (e.g., Most things are basically unconnected and independent from each other [reversed]). All items are measured on a Likert scale ranging from 1(strongly disagree) to 6(strongly agree).
Covariate measures
Locus of Control
Participants completed a brief version of the Locus of Control Scale (Sapp and Harrod 1993) which includes 9 items revealing how much people perceived they have internal control over events (e.g., To a great extent, my life is controlled by accidental happenings). Measured on a Likert scale from 1(strongly disagree) to 7(strongly agree).
Demographics
They also answered several demographics questions (age, gender, political ideology, and social economic status).
Confirmatory Factor Analysis
Items Removed
Several assumptions need to be met before running a confirmatory factor analysis. We identified that no item had a high inter-correlation > .75. Next, we checked the skewedness and kurtosis of each item to be included in the CFA. The closer to zero for both skewedness and kurtosis, the closer to a normal distribution. Any items whose distributions exhibited skewness and/or kurtosis that exceed general guidelines were considered non-normal removed from the analysis (Hair et al., 2017, p. 61).
For skewedness, using the skewness function from the Moments package in R (Komsta and Novomestky 2022), skewness was calculated for each item. Any item where the number is greater than +1 (right skewed) or lower than -1 (left skewed), this is an indication of a substantially skewed distribution. No items were heavily skewed in this dataset.
For Kurtosis, using the kurtosis function from the Moments package in R, kurtosis was calculated for each item. Any item were the number is greater than +3, the distribution is too peaked. Likewise, a kurtosis of less than -3 indicates a distribution that is too flat. Two items showed high kurtosis: “I have great respect for being alive on this earth and part of the universe” and “Listening to the sounds of nature makes me relax” and were removed from the CFA. Three items were identified as having high kurtosis See Table 6. These items were removed from the CFA
Table 6. High Kurtosis Items
## [1] "No items had high or low kurtosis"
A Mardia Test of multivariate normality from the MVN package in R (Korkmaz et al., 2021) indicated that this data is not normal, suggesting that a rotation-method that is robust to non-normal data should be used (Mardia Skewedness = 7681.36, p < .001 and Mardia Kurtosis = 28.32, p < .001).
Model Fitting
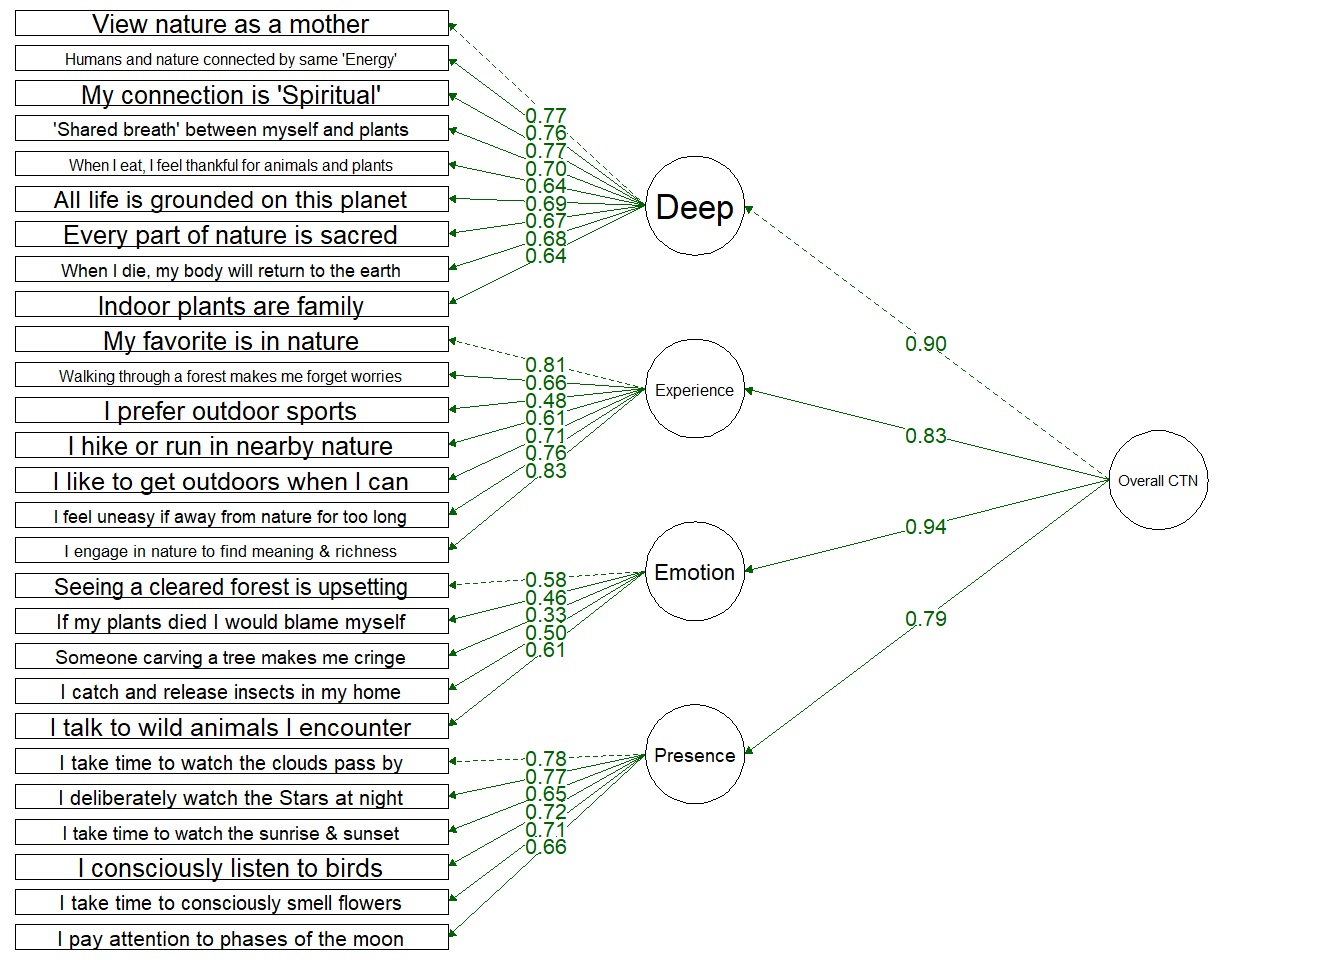
Four factor hierachical Model
Testing a structure which includes an overall Connection to Nature factor and four dimensions:
- Deep: Deeply seeing the self as part of nature
- Experiential: Spending more time in nature and enjoying spending time in nature
- Emotional: Emotional desire to connect with nature and protect it
- Presence: Engaging mindfully and consciously with nature
Items load onto their dimensions well, with the exception of 1 item (“Thinking of someone carving their initials into a tree makes me cringe”) which loaded onto the Emotion dimension at 0.33.
All dimensions loaded onto the single CTN dimension, but these loaded quite highly (especially Deep and Emotion) which suggests these might be driving the overall CTN score.
Fit Indices | df | Chi-Sqa | RMSEAb | RMSEA CI Lower | RMSEA CI Upper | SRMRc | TLId | CFIe | AICf |
|---|---|---|---|---|---|---|---|---|---|
320 | 756.707 | 0.063 | 0.057 | 0.069 | 0.059 | 0.889 | 0.899 | 32,790.1 | |
aCloser to 0 indicate better fit | |||||||||
b(Root mean square error) 0.01 = Excellent; 0.05 = Good; 0.08 = Mediocre | |||||||||
c(Standardized root mean square residual) Closer to 0 indicate better fit | |||||||||
d(Tucker Lewis Index) Closer to 1 indicates better fit | |||||||||
e(Comparative fit index) Closer to 1 indicates better fit | |||||||||
f(Akaike’s Information Criterion) The lower the AIC, the more predictive | |||||||||
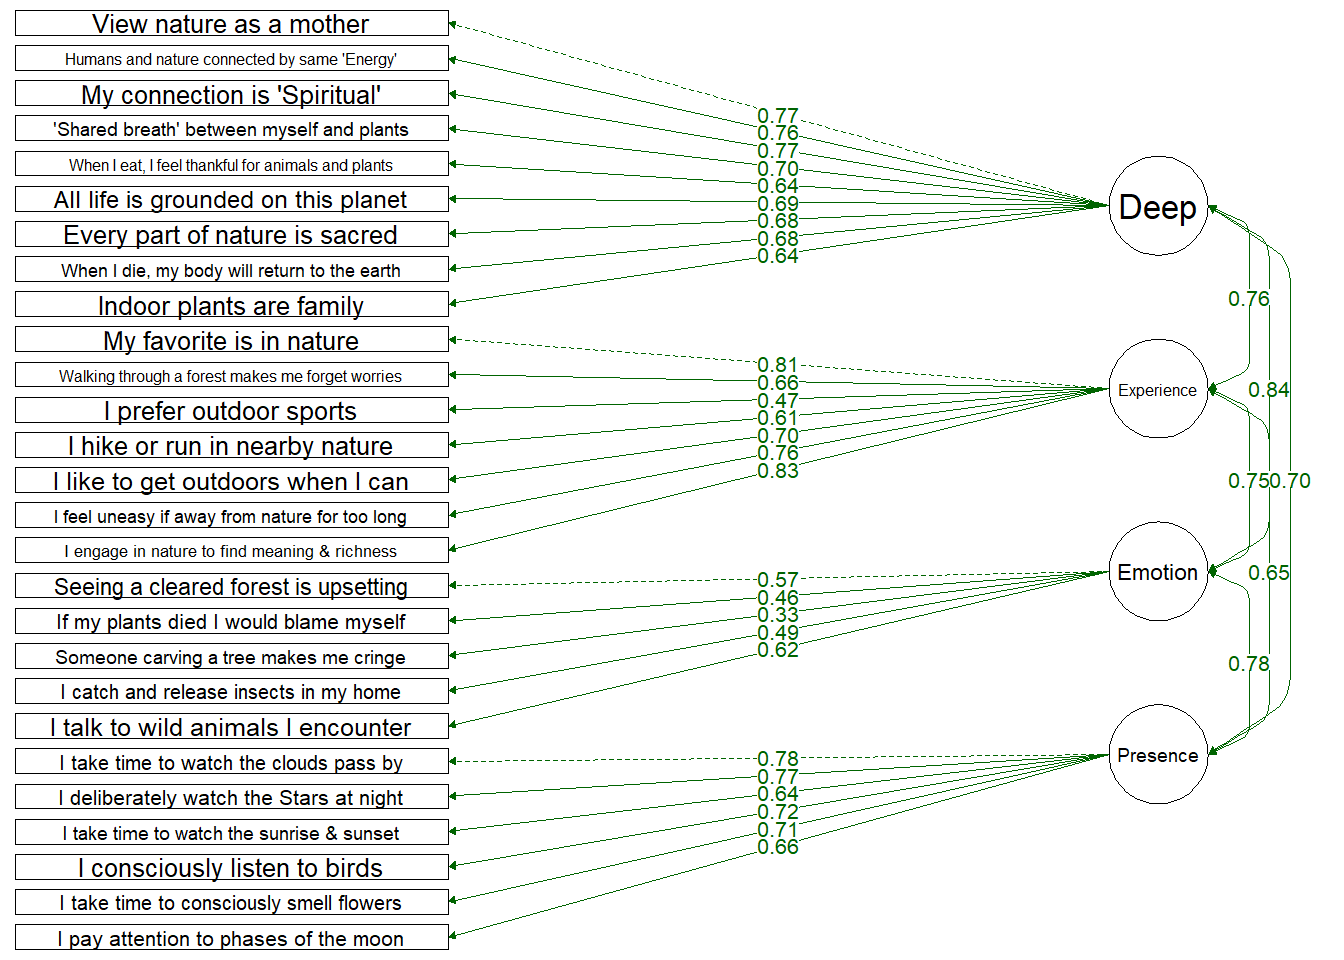
Four Factor
Testing a structure which only includes the four dimensions:
- Deep: Deeply seeing the self as part of nature
- Experiential: Spending more time in nature and enjoying spending time in nature
- Emotional: Emotional desire to connect with nature and protect it
- Presence: Engaging mindfully and consciously with nature
Items load onto their dimensions similarly well to the hierarchical model. Again, 1 item loads weakly: (“Thinking of someone carving their initials into a tree makes me cringe”) which loaded onto the Emotion dimension at 0.33.
Dimensions are intercorrelated reasonable well - not too high as to have multi-collinearity (none above .80)
Fit Indices | df | Chi-Sqa | RMSEAb | RMSEA CI Lower | RMSEA CI Upper | SRMRc | TLId | CFIe | AICf |
|---|---|---|---|---|---|---|---|---|---|
318 | 754.171 | 0.063 | 0.058 | 0.069 | 0.058 | 0.888 | 0.899 | 32,791.56 | |
aCloser to 0 indicate better fit | |||||||||
b(Root mean square error) 0.01 = Excellent; 0.05 = Good; 0.08 = Mediocre | |||||||||
c(Standardized root mean square residual) Closer to 0 indicate better fit | |||||||||
d(Tucker Lewis Index) Closer to 1 indicates better fit | |||||||||
e(Comparative fit index) Closer to 1 indicates better fit | |||||||||
f(Akaike’s Information Criterion) The lower the AIC, the more predictive | |||||||||
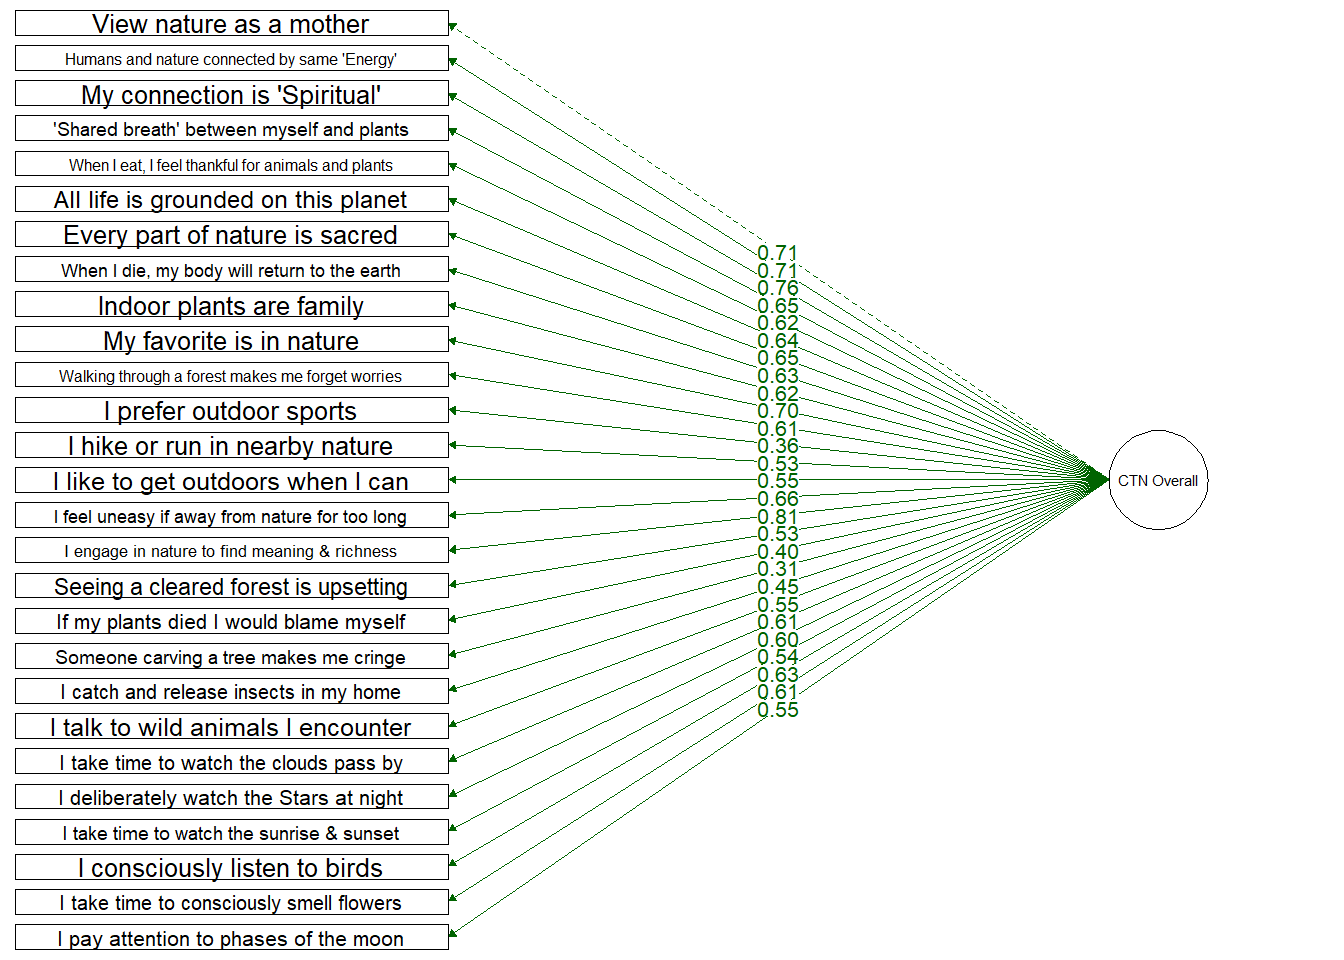
Single Factor
Testing a structure which includes only a single overall Connection to Nature factor
Loadings are slightly weaker onto a single overall CTN factor. Again, 1 item loads weakly: (“Thinking of someone carving their initials into a tree makes me cringe”) which loaded onto the Emotion dimension at 0.31.
Fit Indices | df | Chi-Sqa | RMSEAb | RMSEA CI Lower | RMSEA CI Upper | SRMRc | TLId | CFIe | AICf |
|---|---|---|---|---|---|---|---|---|---|
324 | 1,306.454 | 0.094 | 0.089 | 0.1 | 0.075 | 0.753 | 0.772 | 33,331.84 | |
aCloser to 0 indicate better fit | |||||||||
b(Root mean square error) 0.01 = Excellent; 0.05 = Good; 0.08 = Mediocre | |||||||||
c(Standardized root mean square residual) Closer to 0 indicate better fit | |||||||||
d(Tucker Lewis Index) Closer to 1 indicates better fit | |||||||||
e(Comparative fit index) Closer to 1 indicates better fit | |||||||||
f(Akaike’s Information Criterion) The lower the AIC, the more predictive | |||||||||
Item Selection Based on Model Fit
Both four-factor models (flat and hierarchical) perform better than the single-factor model. There is no difference between the hierarchical and the flat models.
Model | df | Chi-Sq | RMSEA | RMSEA CI Lower | RMSEA CI Upper | SRMR | TLI | CFI | AIC |
|---|---|---|---|---|---|---|---|---|---|
1 Factor | 324 | 1,306.454 | 0.094 | 0.089 | 0.100 | 0.075 | 0.753 | 0.772 | 33,331.84 |
4 Factor | 318 | 754.171 | 0.063 | 0.058 | 0.069 | 0.058 | 0.888 | 0.899 | 32,791.56 |
4 Factor Hierarchical | 320 | 756.707 | 0.063 | 0.057 | 0.069 | 0.059 | 0.889 | 0.899 | 32,790.10 |
##
## Scaled Chi-Squared Difference Test (method = "satorra.bentler.2001")
##
## lavaan NOTE:
##     The "Chisq" column contains standard test statistics, not the
##     robust test that should be reported per model. A robust difference
##     test is a function of two standard (not robust) statistics.
##
##                   Df   AIC   BIC   Chisq Chisq diff Df diff Pr(>Chisq)
## fit_model_hier_4 320 32790 33012  756.71
## fit_model_flat   324 33332 33539 1306.45     388.02       4  < 2.2e-16 ***
## ---
## Signif. codes:  0 '***' 0.001 '**' 0.01 '*' 0.05 '.' 0.1 ' ' 1
We continued with our validation using the Hierarchical four factor model.
Validation
Convergent Validity
Two pre-existing CTN scales were used to identify convergent validity. The Connectedenss to Nature Scale (CNS, Mayer & Frantz, 2004) and the Environmental Identity Scale revised (EID-R, Clayton et al., 2021). The CNS is a 14-item scale designed to measure the cognitive beliefs about how interneconnect one’s self is to nature. It is measured on a Likert scale ranging from 1(strongly disagree) to 5(strongly agree). The EID-R is a 14-item scale designed to measure how interneconnect one’s self is to nature. It is measured on a Likert scale ranging from 1(not at all true of me) to 7(completely true of me).
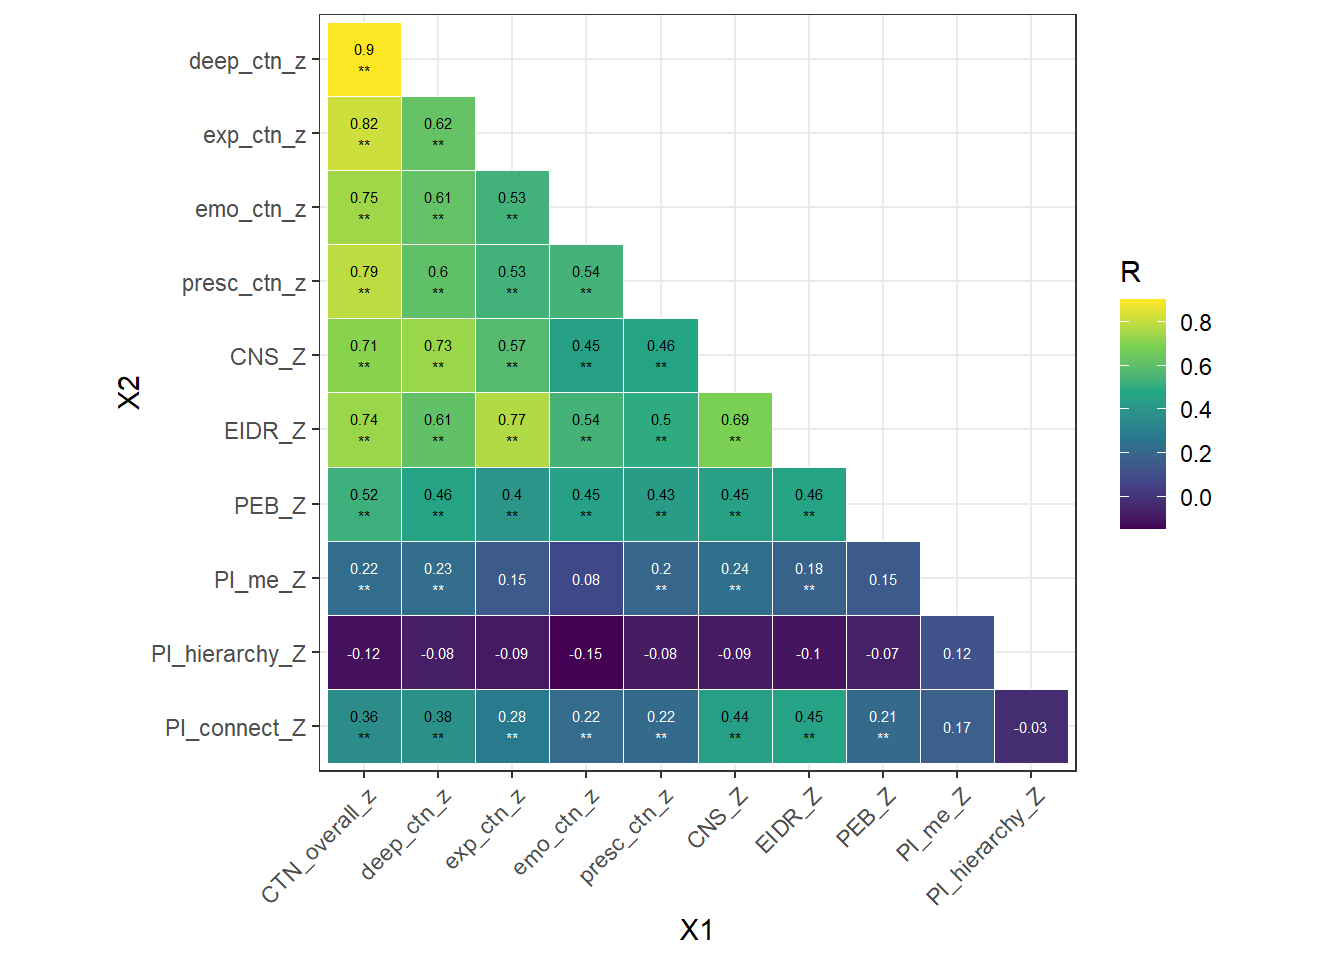
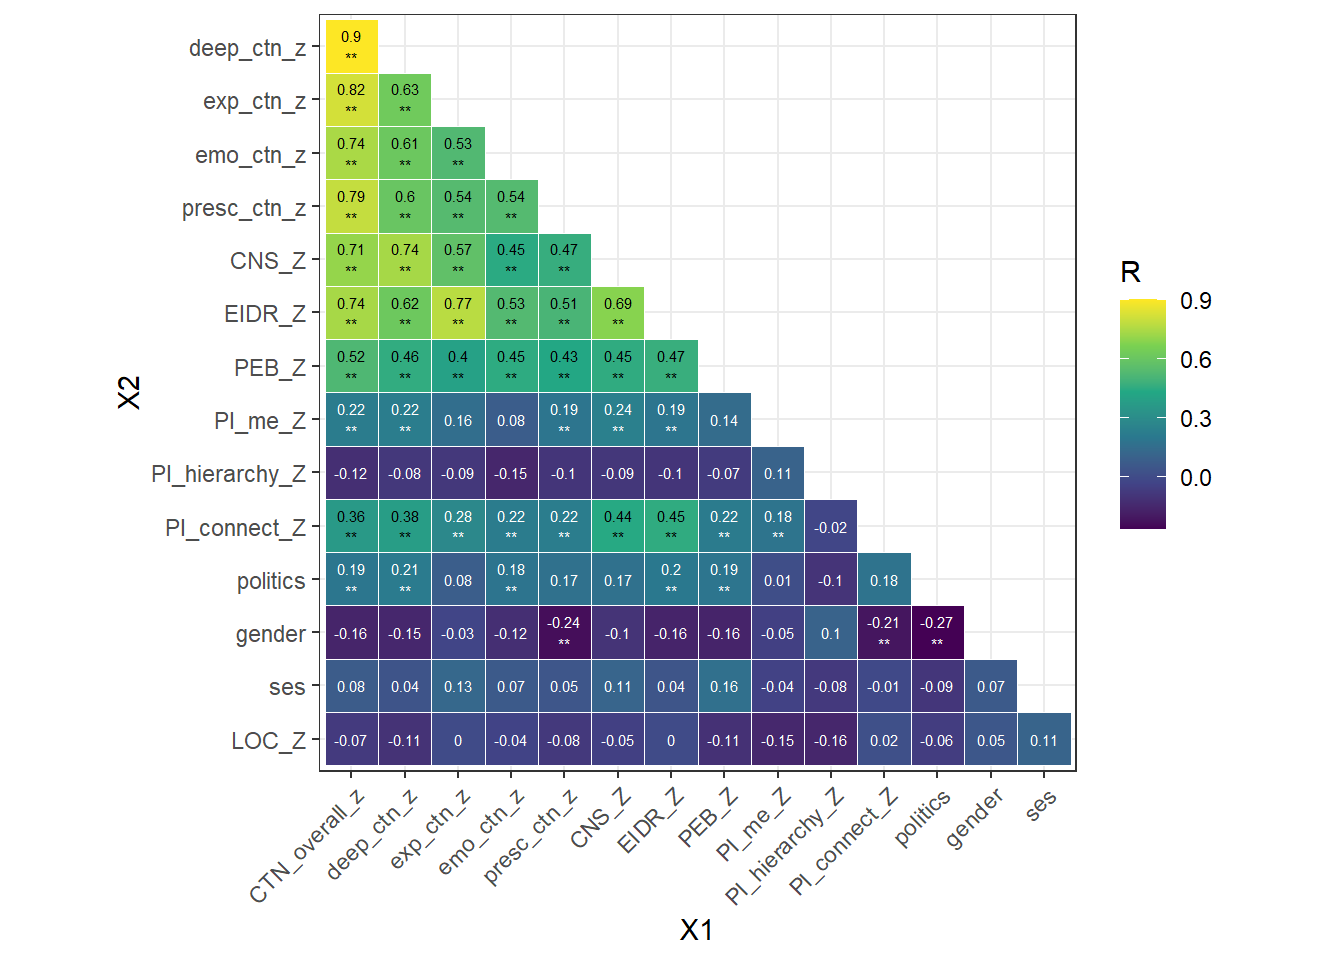
We assessed the convergent validity of the new DEEP CTN scale, that is how closely our new measure is related to other established measures of the same construct. We tested this by looking at the zero order correlation between our new measure and its subscales and two established measures: The Connectedness to Nature Scale (CNS - Mayer & Franz, 2004) and the Environmental Identity Scale revised (EID-R - Clayton et al., 2021). A zero-order correlation found moderate-strong correlation between existing CTN scales and the new subscales of the DEEP CTN scale. See figure below:
Predictive Validity
Two measures of predictive validity were used: Pro-environmental behavior & three subscales of the primal beliefs invetory - the world is interconnected, the world is heirarchical, and the world is about me.
Participants completed the Recurring Pro-environmental Behavior scale (Brick et al., 2017) which asks people to report how often they engage in various pro-environmental behaviors. This scale includes 20 items measured on a Likert scale ranging from 1(never) to 5(always).
Three subscales of the primals beliefs inventory (Clifton et al., 2019) were used to identify worldviews held by participants. The About Me subscale consists of five questions asking how egocentric ones beliefs are (e.g., Whatever is happening around me often feels related to me or something I’ve done). The Hierarchical subscale consists of five questions exploring beliefs about the hierarchical nature of the world (e.g., Things are rarely equal. Most plants and animals, even people, are better or worse than one another.). The Interconnected subscale consists of four items asking how connected or atomistic one believes the world to be (e.g., Most things are basically unconnected and independent from each other [reversed]). All items are measured on a Likert scale ranging from 1(strongly disagree) to 6(strongly agree).
We assessed the predictive validity of the new DEEP CTN scale (i.e., how well our measure can predict participant scores on two theoretically related constructs). The “gold standard” for predictive validity of CTN measures is how well it predicts pro-environmental behavior (PEB) (Clayton, 2003; Clayton et al., 2021; Mayer & Frantz, 2004; Tam, 2013). A zero-order correlation found moderate correlations between PEB and the new subscales of the DEEP CTN scale. See figure below:
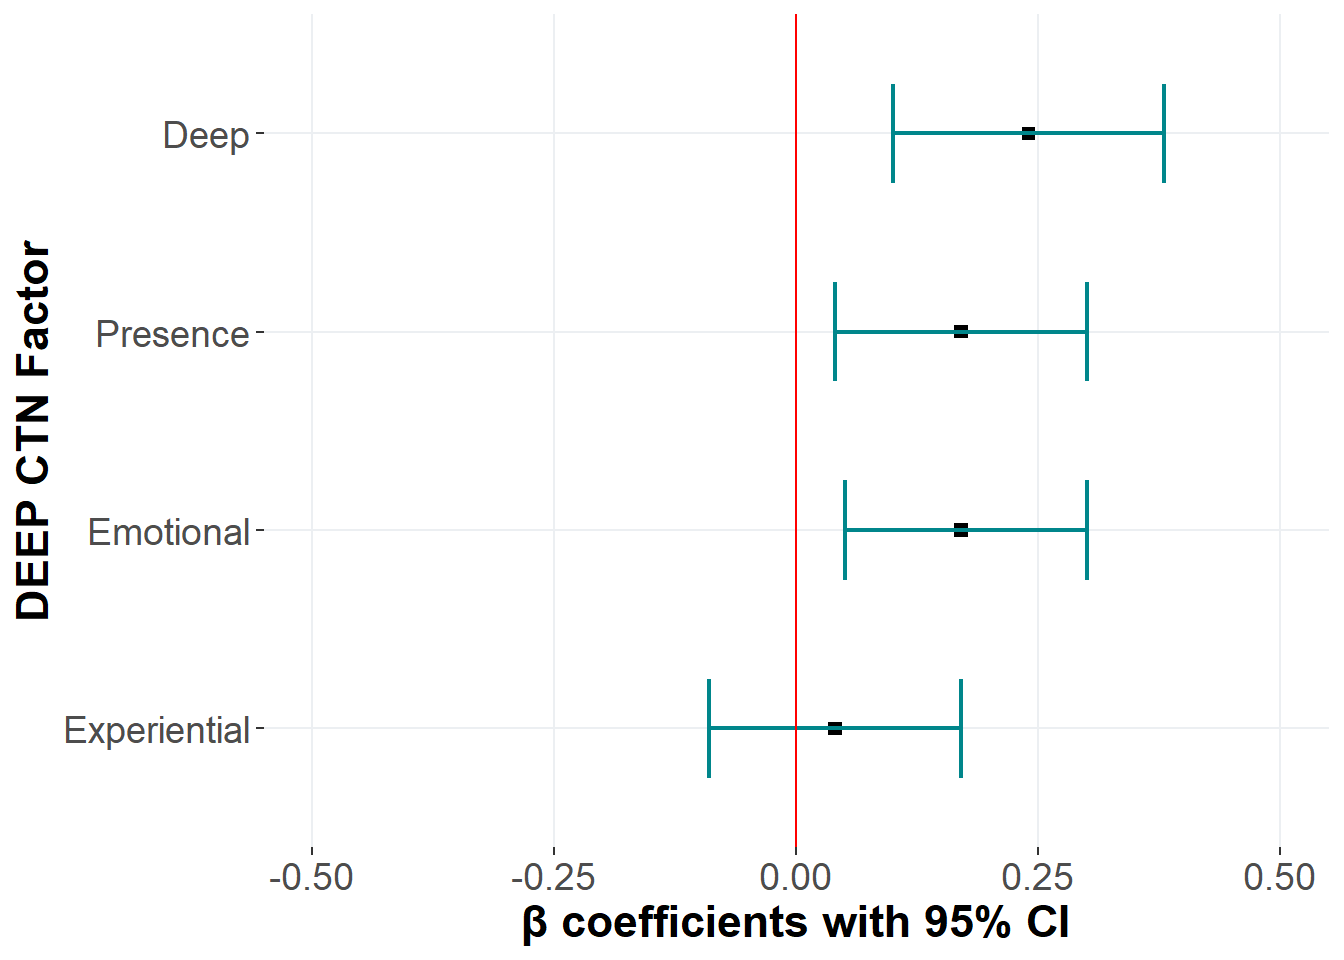
A linear regression with only the subscales of CTN predicting PEB showed that Deep, Emotional, and Presence were adequate to predcict PEB, but not Experiential.
Variable | Partial R2 | p | std Beta* | lower_bound | upper_bound |
|---|---|---|---|---|---|
Deep | 0.09 | 0.00 | 0.24 | 0.10 | 0.38 |
Experiential | 0.04 | 0.54 | 0.04 | -0.09 | 0.17 |
Emotional | 0.07 | 0.01 | 0.17 | 0.05 | 0.30 |
Presence | 0.07 | 0.01 | 0.17 | 0.04 | 0.30 |
*< 0.29 = small; | |||||
Total variance explained by the model = 0.28
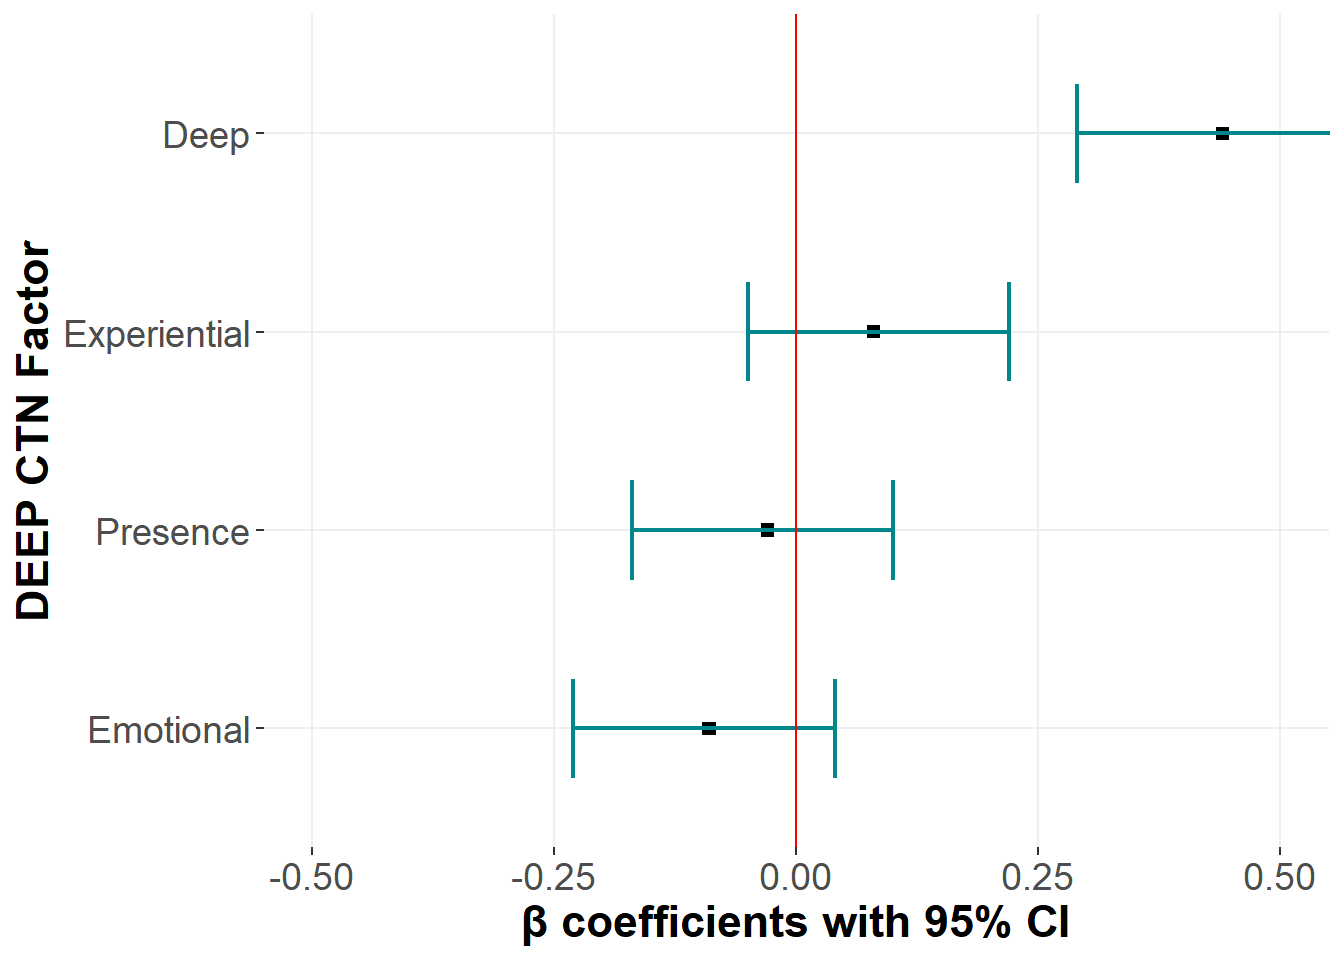
We also suspected that DEEP CTN and its subscales would predict three types of primal world beliefs (Clifton et al., 2019): That the world is interconnected, that the world is not hierarchical, and that the world is not about me (i.e., less egocentric worldviews). A zero-order correlation found weak - moderate correlations between interconnected beliefs and the new subscales of the DEEP CTN scale. We also found weak correlations between egocentric beliefs and the Deep, Presence, and Overall CTN. Only Deep CTN significantly predicted interconnected primal worldviews. See table below:
Variable | Partial R2 | p | std Beta* | lower_bound | upper_bound |
|---|---|---|---|---|---|
Deep | 0.12 | 0.00 | 0.44 | 0.29 | 0.58 |
Experiential | 0.03 | 0.22 | 0.08 | -0.05 | 0.22 |
Emotional | 0.01 | 0.17 | -0.09 | -0.23 | 0.04 |
Presence | 0.02 | 0.63 | -0.03 | -0.17 | 0.10 |
*< 0.29 = small; | |||||
Total variance explained by the model = 0.18
Incremental Validity
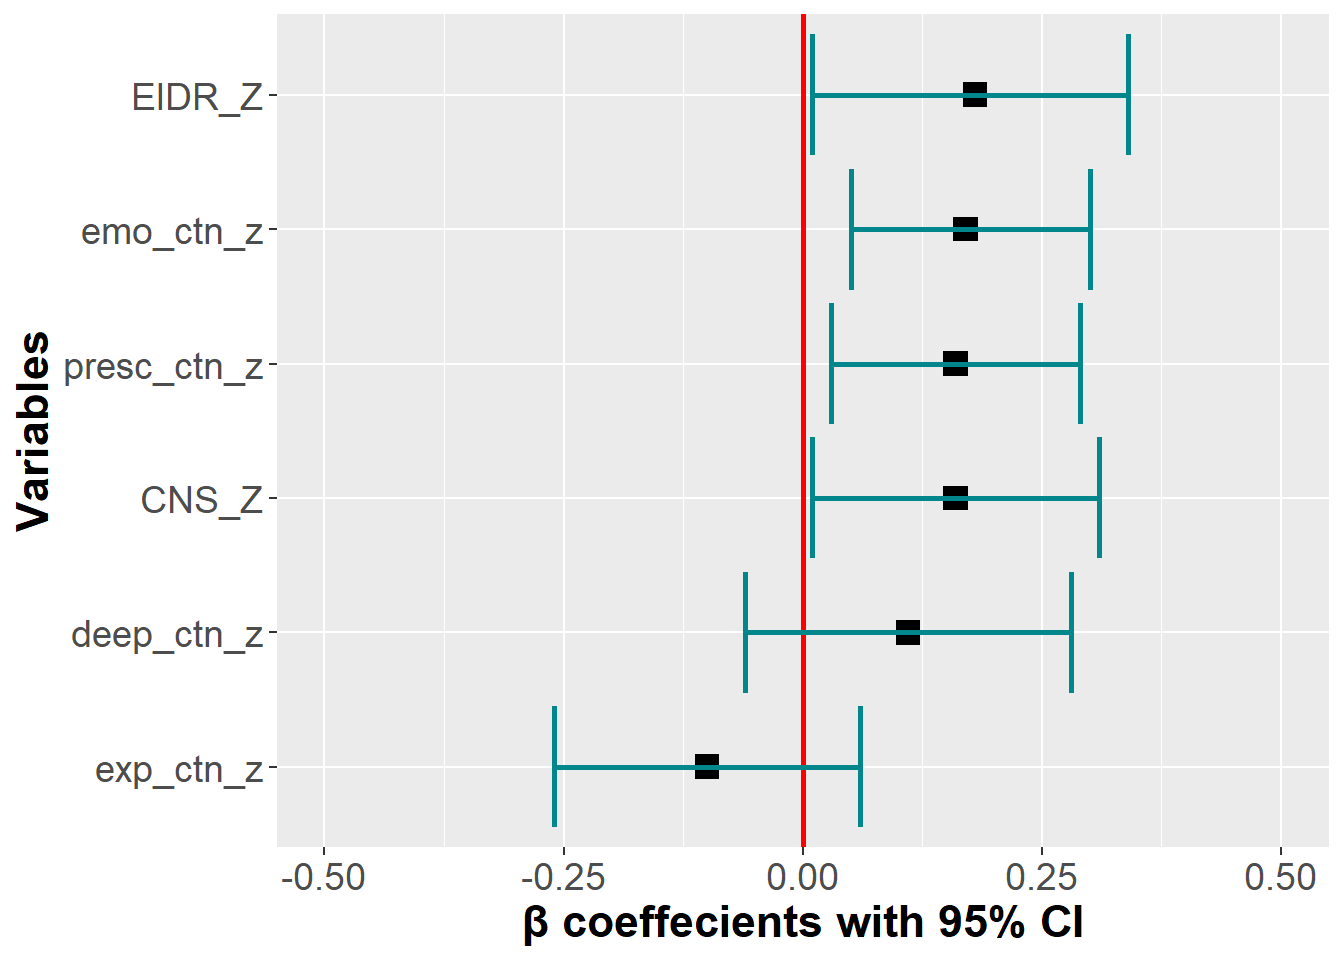
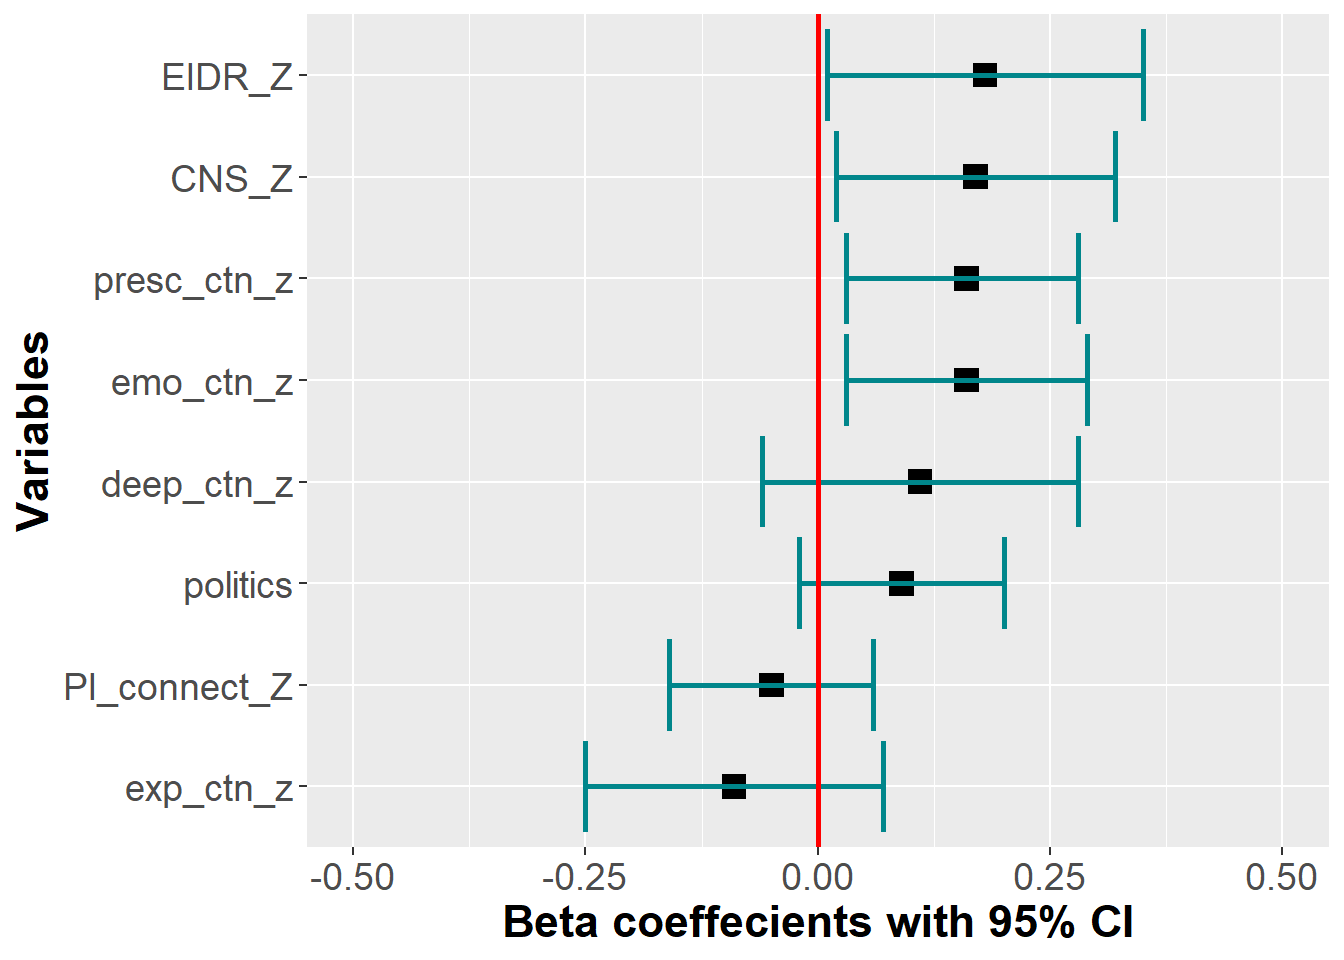
We explored if the DEEP CTN scale and its facets would perform above and beyond existing CTN scales (i.e., CNS and EID-R) when predicting PEB. A linear regression model was run, which included the dimensions of the DEEP CTN scale and the existing CTN measures (CNS and EIDR) were entered simultaneously to predict PEB. Note that because overall CTN was highly intercorrelated with Deep and Emotional, it was left out and only the four dimensions were included.
We found that the Emotional and Presence subscales remained significant predictors when existing measures of CTN were entered into the model. The Deep subscale was no longer a significant predictor. Both our subscales were of equal predictive value compared to the existing measures.
variable | Partial R2 | p | std Beta* | lower_bound | upper_bound |
|---|---|---|---|---|---|
deep_ctn_z | 0.06 | 0.20 | 0.11 | -0.06 | 0.28 |
exp_ctn_z | 0.03 | 0.21 | -0.10 | -0.26 | 0.06 |
emo_ctn_z | 0.06 | 0.01 | 0.17 | 0.05 | 0.30 |
presc_ctn_z | 0.05 | 0.01 | 0.16 | 0.03 | 0.29 |
CNS_Z | 0.06 | 0.04 | 0.16 | 0.01 | 0.31 |
EIDR_Z | 0.05 | 0.04 | 0.18 | 0.01 | 0.34 |
*< 0.29 = small; | |||||
Total variance explained by the model = 0.31
Covariates
Participants completed a brief version of the Locus of Control Scale (Sapp & Harrod, 1993) which includes 9 items revealing how much people perceived they have internal control over events (e.g., To a great extent, my life is controlled by accidental happenings). Measured on a Likert scale from 1(strongly disagree) to 7(strongly agree). Participants also answered several demographics questions (age, gender, political ideology, and social economic status).
We also tested the robustness of our new DEEP CTN scale, by testing if the DEEP CTN scale and its facets are significant predictors of PEB after controlling for known covariates of these outcomes: political ideology, gender, and socio-economic status (SES). We fist inspected a zero order correlation to identify which covariates should be included. Including any variable that: strongly correlated with PEB AND weakly correlated with the Deep CTN Scale may reduce variance in the dependent variable and therefore enhance the likelihood of seeing significant effects of the DEEP CTN scale. Further, if an additional variable is… strongly correlated with BOTH PEB AND the Deep CTN Scale, its inclusion in the model will address potential mediating effects regarding the relationship between the Deep CTN Scale and a DV of interest. In either case this would suggest it’s important to include as a covariate.
This resulted in including the following covariates: Politics (r = .19** with PEB & r = .18** to .23** with DEEP CTN dimensions) Primal Beliefs - The world is interconnect (r = .21** with PEB & r = .22** to .38** with DEEP CTN dimensions)
A multiple linear regression model where dimensions of the DEEP CTN scale and existing CTN measures (CNS and EIDR) and the covariates (politics & primal belief interconnectedness) were entered simultaneously to predict PEB is reported in the table below.
By adding the covariates, both Emotional and Prescence subscales remained significant predictors of PEB. Adding covariates to the model did not improve the fit of the model above the variables in the incremental validity model (F(2) = 1.731, p = 0.179).
variable | Partial R2 | p | std Beta* | lower_bound | upper_bound |
|---|---|---|---|---|---|
deep_ctn_z | 0.06 | 0.21 | 0.11 | -0.06 | 0.28 |
exp_ctn_z | 0.03 | 0.27 | -0.09 | -0.25 | 0.07 |
emo_ctn_z | 0.05 | 0.01 | 0.16 | 0.03 | 0.29 |
presc_ctn_z | 0.05 | 0.02 | 0.16 | 0.03 | 0.28 |
CNS_Z | 0.05 | 0.03 | 0.17 | 0.02 | 0.32 |
EIDR_Z | 0.05 | 0.04 | 0.18 | 0.01 | 0.35 |
PI_connect_Z | 0.01 | 0.36 | -0.05 | -0.16 | 0.06 |
politics | 0.01 | 0.10 | 0.09 | -0.02 | 0.20 |
*< 0.29 = small; | |||||
Total variance explained by the model = 0.32
Discussion
The findings from three exploratory factor analysis and one confirmatory factor analysis reveal that the construct of connection to nature can be described by four distinct factors:
- Deep Identity: Deeply seeing the self as part of nature
- Experiential Connection to nature: Spending and enjoying time in nature
- Emotional Connection to nature: Desire to connect with and protect nature
- Presence within nature: Being deliberately mindful and present within nature
These factors were shown to both relate to and extend beyond two existing measures of connection to nature. The Connectedness to Nature scale (Mayer and Frantz 2004) was most strongly correlated with the deep identity factor. This aligns with the CNS as a cognitive measure of how much ones identity is interrelated with nature. The other three factors also correlated with the CNS, however they correlated only moderately. The revised Environmental Identity scale (Clayton et al. 2021) was most strongly corrleated with both the deep identity and experiential connection factors. This also aligns with past research that has shown the EID-r to be described as a multidimensional scale that describes ones identity and experiences within nature. Both emotional connection and presence within nature also correlated moderately with the EID-r.
Our study also provided evidence for the predictive validity of the scale. We found differential predictive value across the four factors in predicting pro-environmental behavior and primal beliefs that the world is interconnected. All but the experiential connection factor uniquely predict pro-environmental behavior, with deep identity being the strongest predictor. However, when including previous measures of CTN, only emotional connection and presence within nature remained significant predictors of PEB (along both the existing measures). These two factors remained significant even after controlling for participants political ideology and their worldviews. Deep identity was the only factor that uniquely predicted primal beliefs that the world is interconnected suggesting that this factor best represents the more cognitive components of connection to nature.
Limitations
The confirmatory factor analysis and validation of the DEEP CTN Scale was conducted on a student sample which restricts the generalizability of these results. It is evident from the three EFA samples that there are differences in how connection to nature is represented in student populations compared to a more general population sample. For example, many items that are classified as relating to ones identity as connected to nature loaded on the Deep Identity factor within the student sample, while these items failed to load on any factor or loaded on the Experiential connection factor in a general sample. Similarly, many of the spiritual items that were included in the Deep Identity factor loaded strongly in the general population samples but failed to load on any factor in the student sample. One explanation for this is that connection to nature appears to develop over the lifespan. It tends to decline during adolescence and not strengthen again until mid-to-late adulthood (Hughes et al. 2019). It may be that the Deep identity items that showed discrepancies across samples with varying ages picked up on this developmental trajectory. Because of this variation across age-groups we are currently collecting data from a general population to conduct a pre-registered CFA and validation that attempts to replicate the findings in this study.
Future Directions & Conclusion
Based on these preliminary data we conclude that connection to nature is indeed a multi-dimensional construct and these constructs differentially predict important correlates such as pro-environmental behavior and worldviews. Most importantly, our results reveal that experiential connection to nature may be the least important when it comes to promoting PEB. Given that many interventions to promote CTN are focused on getting people “out into nature” it is concerning that these mere exposure may not be the driving factor in promoting PEB. Our results suggests that interventions should instead focus on building an emotional connection with nature and/or encouraging mindful engagement within nature.
References
Brick, Cameron, David K. Sherman, and Heejung S. Kim. 2017. “‘Green to Be Seen’ and ‘Brown to Keep down’: Visibility Moderates the Effect of Identity on Pro-Environmental Behavior.” Journal of Environmental Psychology 51: 226–38. https://doi.org/10.1016/j.jenvp.2017.04.004.
Brügger, Adrian, Florian G. Kaiser, and Nina Roczen. 2011. “One for All?: Connectedness to Nature, Inclusion of Nature, Environmental Identity, and Implicit Association with Nature.” European Psychologist 16 (4): 324–33. https://doi.org/10.1027/1016-9040/a000032.
Clayton, Susan, Sandor Czellar, Sonya Nartova-Bochaver, Jeffrey C. Skibins, Gabby Salazar, Yu-Chi Tseng, Boris Irkhin, and Fredy S. Monge-Rodriguez. 2021. “Cross-Cultural Validation of a Revised Environmental Identity Scale.” Sustainability 13 (4): 2387. https://doi.org/10.3390/su13042387.
Clifton, Jeremy D. W., Joshua D. Baker, Crystal L. Park, David B. Yaden, Alicia B. W. Clifton, Paolo Terni, Jessica L. Miller, et al. 2019. “Primal World Beliefs.” Psychological Assessment 31 (1): 82–99. https://doi.org/10.1037/pas0000639.
Davis, Jody L., Benjamin Le, and Anthony E. Coy. 2011. “Building a Model of Commitment to the Natural Environment to Predict Ecological Behavior and Willingness to Sacrifice.” Journal of Environmental Psychology 31 (3): 257–65. https://doi.org/10.1016/j.jenvp.2011.01.004.
Dong, Xuebing, Shengmin Liu, Hongbo Li, Zhi Yang, Shichang Liang, and Nianqi Deng. 2020. “Love of Nature as a Mediator Between Connectedness to Nature and Sustainable Consumption Behavior.” Journal of Cleaner Production 242: 118451. https://doi.org/10.1016/j.jclepro.2019.118451.
Gould, Rachelle K., and P. Wesley Schultz. 2021. “Challenges to Understanding Nonmaterial Dimensions of Human-Nature Connections, and How to Address Them.” Ecology and Society 26 (3): art14. https://doi.org/10.5751/ES-12604-260314.
Hatty, Melissa Anne, Liam David Graham Smith, Denise Goodwin, and Felix Tinoziva Mavondo. 2020. “The CN-12: A Brief, Multidimensional Connection with Nature Instrument.” Frontiers in Psychology 11. https://doi.org/10.3389/fpsyg.2020.01566.
Hughes, Joelene, Mike Rogerson, Jo Barton, and Rachel Bragg. 2019. “Age and Connection to Nature: When Is Engagement Critical?” Frontiers in Ecology and the Environment 17 (5): 265–69. https://doi.org/10.1002/fee.2035.
Ives, Christopher D., David J. Abson, Henrik von Wehrden, Christian Dorninger, Kathleen Klaniecki, and Joern Fischer. 2018. “Reconnecting with Nature for Sustainability.” Sustainability Science 13 (5): 1389–97. https://doi.org/10.1007/s11625-018-0542-9.
Komsta, Lukasz, and Frederick Novomestky. 2022. “Moments: Moments, Cumulants, Skewness, Kurtosis and Related Tests.” https://CRAN.R-project.org/package=moments.
Kurth, Angela M., Darcia Narvaez, Reilly Kohn, and Andrea Bae. 2020. “Indigenous Nature Connection: A 3-Week Intervention Increased Ecological Attachment.” Ecopsychology 12 (2): 101–17. https://doi.org/10.1089/eco.2019.0038.
Mayer, F.Stephan, and Cynthia McPherson Frantz. 2004. “The Connectedness to Nature Scale: A Measure of Individuals’ Feeling in Community with Nature.” Journal of Environmental Psychology 24 (4): 503–15. https://doi.org/10.1016/j.jenvp.2004.10.001.
Meis-Harris, Julia, Kim Borg, and Bradley S. Jorgensen. 2021. “The Construct Validity of the Multidimensional AIMES Connection to Nature Scale: Measuring Human Relationships with Nature.” Journal of Environmental Management 280. https://doi.org/10.1016/j.jenvman.2020.111695.
Olivos, Pablo, and Juan-Ignacio Aragonés. 2011. “Psychometric Properties of the Environmental Identity Scale (EID).” Psyecology 2 (1): 65–74. https://doi.org/10.1174/217119711794394653.
Sapp, Stephen G., and Wendy J. Harrod. 1993. “Reliability and Validity of a Brief Version of Levenson’s Locus of Control Scale.” Psychological Reports 72 (2): 539–50. https://doi.org/10.2466/pr0.1993.72.2.539.
Schultz, P. Wesley. 2001. “The Structure of Environmental Concern: Concern for Self, Other People, and the Biosphere.” Journal of Environmental Psychology 21 (4): 327–39. https://doi.org/10.1006/jevp.2001.0227.
Schwartz, Shalom H. 1992. “Universals in the Content and Structure of Values: Theoretical Advances and Empirical Tests in 20 Countries.” In, 25:1–65. Elsevier. https://doi.org/10.1016/S0065-2601(08)60281-6.
———. 1999. “A Theory of Cultural Values and Some Implications for Work.” Applied Psychology 48 (1): 23–47. https://doi.org/10.1111/j.1464-0597.1999.tb00047.x.
Stern, Paul C., and Thomas Dietz. 1994. “The Value Basis of Environmental Concern.” Journal of Social Issues 50 (3): 65–84. https://doi.org/10.1111/j.1540-4560.1994.tb02420.x.